Basic knowledge of the spectroelectrochemical method
In the early 1960s, Professor RM. Adam, a renowned American electrochemist, was supervising graduate student T. Kuwana, to observe the electrode reaction during the electrochemical oxidation of o-phenylenediamine derivatives, accompanied by color changes, so he proposed whether to design an electrode that can be seen through and use spectroscopy to identify all the colored substances formed. This new method was realized by T. Kuwana, in 1964. The first optically transparent electrode (OTE) he used was a thin layer of SnO2 doped on a sheet of glass. This conductive glass is called Nesa glass, which can be measured as an electrode at the same time. The absorption of light by the concentration of electroactive substances in the electrolytic cell opened the field of spectroelectrochemical research. Spectroelectrochemistry is one of the most popular research areas for the development of electrochemistry and electroanalytical chemistry, both in the past and in the future.
- Chapter I - Introduction
- Chapter II - Optically Transparent Electrode - Part 1
- Chapter III - Optically Transparent Electrode - Part 2
- Chapter IV - Optically transparent thin layer spectroelectrochemistry - Part 1
- Chapter V - Optically transparent thin layer spectroelectrochemistry - Part 2
- Chapter VI - Optically transparent thin layer spectroelectrochemistry - Part 3
- Chapter VII - Optically transparent thin layer spectroelectrochemistry - Part 4
Chapter 1 - Introduction
Spectroelectrochemistry (SEC) is a general term for electrochemical methods that apply in situ or ex-suit spectroscopy technology to study the interface of the electrode solution.
Spectroelectrochemical method (SEC) is characterized by the use of a spectroelectrochemical cell to perform electrochemical and spectroscopic measurements simultaneously, to understand the reaction on the electrode surface and the interface between the electrode and the solution and the electronic state of the molecule.
Spectroelectrochemical measurement method is classified according to the spectrum measurement cell, and can be divided into ex-situ and in-situ.The first is a method of measuring electrodes by spectroscopic measurement outside the electrolytic cell, such as low energy electron diffraction, Auger electron spectroscopy, X-ray photoelectron spectroscopy, etc. The disadvantage of this off-site measurement is that it is impossible to accurately observe the status of some unstable electrochemical products or intermediates, and it is difficult to meet the needs of electrochemical mechanism research. The latter one refers to the spectroscopic measurement performed in the electrolytic cell, the method of observing the inside of the electrolytic cell, especially the electrode/solution interface state and process during the electrochemical operation is called the on-site method. For example: on-site infrared spectroscopy, Raman spectroscopy, fluorescence spectroscopy, polarized spectroscopy, ultraviolet-visible spectroscopy, paramagnetic resonance spectroscopy, circular dichroism, etc.1-1). This series will focus on UV-Vis spectroelectrochemistry, the most studied and theoretically most solid method for a comprehensive understanding of this. Spectroelectrochemical techniques are of great interest both for the widespread application of this method and for the future development of other spectral wave electrochemical techniques.
Spectroelectrochemical methods can be divided into light transmission method, reflection method and parallel incidence method according to the light incidence method.

Fig. 1-1. Spectroelectrochemical methods are divided according to the method of light incidence.
Fig. 1-1 Spectroelectrochemical method, according to the light incident method can be divided into light transmission method, reflection method and parallel incidence method.
Transmittance is the method by which an incident beam of light is transmitted vertically across an electrode and its adjoining solution. As shown in Fig. (a) and (b), the reflection method includes both internal reflection (c) and specular reflection (d). In the internal reflection method, the speed of incident light passes through the back of the light-transmitting electrode and penetrates into the electrode solution interface, so that the incident angle is just larger than the reflection angle, and the light is totally reflected. The specular reflection rule is to let light enter from the solution side, reach the electrode surface, and be reflected by the electrode surface. The parallel incidence method (e) and (f) a light beam is emitted between an electrode and a solution near the electrode surface.
There is also a classification method, which can be divided into thin layer spectroelectrochemical method (b) and (f) and semi-infinite diffusion spectroelectrochemical method (a), (d) and (e) according to the relative thickness of the solution layer near the electrode.
The thin layer spectroelectrochemical method involves the exhaustive electrolysis of the active material in the electrolytic cell.
Therefore, in general thin-layer spectroelectrochemical experiments, longer excitation time is often used, such as longer electrolysis time in potential step experiments and slower potential scan rate in cyclic voltammetry experiments.
Semi-infinite diffusion spectroscopy electrochemical experiments generally use a shorter excitation time. Commonly used electrical signals are single-potential step, dual-potential step, linear potential sweep and constant current.
In this series we will introduce a basic principles of a transmission-thin layer spectroelectrochemistry and their applications in electrochemical analysis.
The basic measurement system requires a spectrometer, light source, transmissive electrolysis cell, potentiostat, and computer. You also need a circuit that can trigger the control, to carry out spectroelectrochemical synchronized measurement control.
For a simple transmission experiments, a standart laboratory spectrometers can usually be used.
There are many types of spectrometers. When combined with electrochemical measurement, the electrode connection for electrochemical measurement, the laboratory space and the difficulty of system installation should be considered.
It is recommended to use a small spectrometer with a CCD array detector.
For thin-layer spectroelectrochemical measurements, the electrolyte is typically injected into a thin quartz cell. The thickness of the liquid layer is about 50-200 µm. A transparent light-transmitting electrode or grid-type light-transmitting electrode is built as the working electrode. The light is irradiated in the direction of the electrode, the transmitted light is detected by the light receiving element, and the absorbance is measured.
The thin layer of solution is used to quickly achieve complete electrolysis of the active reactants in the electrolysis cell, minimizing the effect of the active reactants in solution on the product absorbance measurements.
By changing the absorption wavelength and absorbance in the spectroscopic spectrum, the chemical species near the electrode can be identified.
Spectroelectrochemical methods have unique advantages over conventional electrochemical methods in the description of reaction mechanisms and kinetics. Parameter determination, based on the measurement of current and potential, e.g. current versus sweep speed, concentration, time or electrode rotation speed, among other parameters. The main disadvantage is that this pure electrochemical measurement lacks the characteristics of the electrode reaction molecules, the current only represents the total rate of all processes occurring on the electrode surface, and there is no useful direct information about the reaction products or intermediates. Similarly, most of the studies on the electrode/electrolyte solution interface structure rely on capacitance measurement, and molecular level information cannot be obtained.
Spectroelectrochemistry has the following advantages over the usual electrochemical methods.
- It provides molecular information on electrode reaction products and intermediates. The absorption spectrum of a substance on the surface of a solution or electrode can be recorded while changing the form of the active substance present on the electrode by applying an excitation potential signal. Using fast scanning spectrophotometry, it can also monitor the useful information of the intermediate reaction intermediate molecular spectrum1-2).
- It is highly selective. Spectroelectrochemistry makes use of both electrochemical substances with different redox potentials to control them, as well as various substances. With different molecular spectral properties, many electrical processes that are difficult to distinguish electrochemically can be distinguished by spectroelectrochemical methods1-3).
- Not affected by charging current and residual current. For example, when spectroelectrochemical methods are used to monitor protein characteristics, changes in absorption spectrum can be easily studied without being affected by the electrocatalyst medium.
- Very slow heterogeneous electron transfer and homogeneous chemical reactions can be studied. For example, the first electronic step in the reduction of vitamin B12 is very slow, and it can be easily studied by thin-layer spectroelectrochemistry1-4).
- The adsorption orientation of electroactive substances on the electrode surface can be studied. As long as the substance has spectral absorption in the ultraviolet-visible range, the adsorption amount of the adsorbed substance on the electrode surface and its adsorption orientation can be obtained.
Click to watch this lecture
References:
1-1) T. Kuwana, R.K.Darlington and D.W. Leedy, Anal. Chem., 36,2036(1964).
1-2) Lin Zhonghua, Ye Siyu, Huang Mingdong and Shen Cultivation. Optical methods in electrochemistry. Beijing Science Press, (1990).
1-3) Bcwick, Jhon M, Meller and B.S. Pons, Electrochim Acta. 23,77 (1978).
1-4) Xie Yuanwu, Dong Shaojun, Spectroelectrochemical Method-Theory and Application, Jilin Science and Technology Press.
Chapter II - Optically Transparent electrode (Part 1)
1. Requirements for optically transparent electrodes
The optically transparent electrode used in spectroelectrochemistry should meet the requirements of both spectral and electrical properties. The ideal optically transparen electrode should have good light transmission and low resistance value. In fact there are not many materials that meet these two requirements, and a compromise approach is generally used 2-1).
Several types of optically transparent electrodes are discussed below.
2. SnO2 and In2O3 optically transparent electrode
2.1 SnO2 optically transparent electrode
SnO2 glass coated with a thin layer of Sb doped with its trade name is Nesa glass. The coating is usually about 0.8 to 1.0 µm. It is made by spraying an acidic solution of SnCl4 onto a glass or quartz substrate and thermally decomposing it. The pure tin oxide film has polycrystalline characteristics, and its conductivity is due to the oxygen defect and the defect structure of interstitial tin atoms, and the doping of oxygen impurities in the cassiterite crystal. Doped tin oxide is more commonly made by adding antimony atoms. As the core of Sn(IV) in the tin oxide lattice is replaced by antimony Sb(III), the density of n-type carriers increases by more than 1020 carrier⁄cm2 can reach a surface resistance of less than 15 Ω⁄sq. These SnO2 films can serve as a completely inert and chemically stable surface in electrochemical research.
The typical spectrum of n-type tin oxide SnO2 coating on the transparent substrate is shown in Fig. 2-1. At 360 nm on the glass substrate, the sharp attenuation of the light transmittance is due to the absorption of the glass itself. Coated on a quartz plate, the outside direction of the optical window can be extended to the wavelength of 300nm. Therefore, the SnO2 optically transparent electrode is only suitable for research in the visible light range.
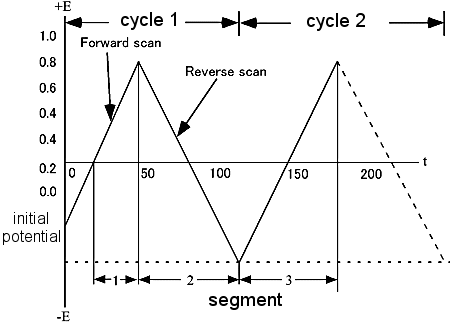
Fig. 2-1. Transmission spectra of Sn02 coating on different substrates.
(a) Glass, 3 Ω⁄sq; (b)Vicor, 6 Ω⁄sq; (c) Quartz,12 Ω⁄sq2-1)
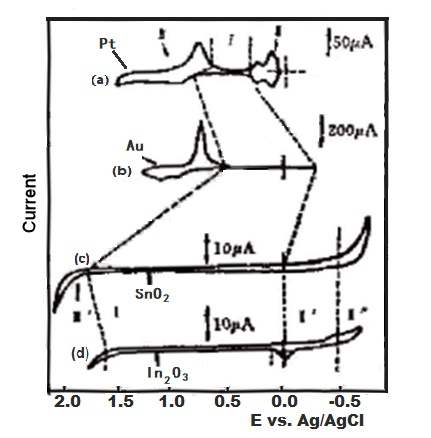
Fig. 2-2. Comparison of current-potential curves of Pt, Au, SnO2 and In2O3 in 1M H2SO4 solution.
The range of potentials applied to the SnO2 coated electrode in aqueous solution is much wider than that applied to the Pt and Au electrodes 2-2). Figure 2-2 is a comparison of the current-potential curves for Pt, Au, SnO2 and In2O3 in a 1 M H2SO4 medium. The current-voltage (i-E) curves can be divided into three main regions, which have been studied extensively for both platinum and gold electrodes. For both electrodes, if the potential is maintained in the hydrogen emitting region for a period of time, the metal film will be irreversibly damaged.
For tin oxide and indium oxide, the charge on the electrode changes monotonously in the entire area. Because the electrode is already an oxide, it is usually the highest oxidation state of the metal. When the potential increases in the positive direction, there is no oxide formation. Obviously, the potential of Faraday current region 1 is as wide as 1.5 V. The boundary of these oxide films in the direction of positive potential zone III′ is for the precipitation of oxygen, and the boundary zone II′ in the direction of negative potential is the oxide reduction to metal The lower valence state of the oxide, hydrogen evolution or surface reduction to the metal state zone II″, so similar to the metal electrode. Therefore, delay electrolysis at a very negative potential will produce irreversible and harmful changes.
It can be seen from Fig. 2-2. that compared with platinum or gold electrodes, SnO2 and In2O3 tin oxide and indium oxide electrodes have a wider redox potential window, however, carriers will be generated at a potential that is more positive than the potential window. Therefore, the rate of any Faraday transfer (such as oxidation of trivalent cerium) under a very positive potential is limited by the charge transfer process of the semiconductor film. In the case of low doping content, the tunneling effect may be the main electron transfer mechanism. In the case of high doping content, other factors including the composition of the surface oxide may be the main factor affecting electron transfer.
The hydrogen evolution zone II on the metal film electrode is replaced by II′, II″ on the semiconductor. The difference between the zone I and II′ is that the small Faraday current may be related to the surface electrode reaction, and its current size is the same as that of the zinc oxide electrode surface Part of the reduction is related to the current, which is only observed in deoxygenated solutions (less than 10 - 5 mol⁄L O2 and increases in alkaline solutions. The potential passes through the region II&pirme; to produce irreversible reduction of semiconductors. Due to some surface degradation such as the dissolution of the layer, zinc oxide coated electrodes are not suitable for research in high alkaline pH solutions. Indium oxide motors behave similarly to tin oxide.
In addition, the polyester sheet coated with metal oxide can also be used as a optically transparent electrode, showing a lower impedance (10 -200 Ω), and it is much cheaper than quartz and glass as a substrate. The flexibility of the sheet makes it suitable for non-planar geometries, and the electrode is relatively stable in water and non-aqueous solvents. Its main disadvantage is still limited due to the absorption of the polyester plastic substrate in the infrared and ultraviolet regions. For applications in the visible light range.
2. 2 In2O3 optically transparent electrode
In2O3 crystal has two crystal types, cubic phase (wurstite type) and triangular phase (corundum type). Theoretically, pure indium oxide film has high resistance and almost no conductivity, but its performance can be effectively adjusted by doping. Doping Sn, Mo, Sb and other elements can obtain N-type indium oxide film materials with ideal electrical properties , Significantly improve the conductivity of the indium oxide film and improve the conductivity of the film. At present, the most studied and most excellent comprehensive performance is mainly tin-doped indium oxide film, namely ITO film (Indium Tin Oxide). Tin-doped indium oxide (ITO) films are widely used as transparent electrodes in optoelectronic devices. Including liquid crystal displays, plasma display panels and solar cells. Although the ITO film shows transparency and conductivity at high room temperature, the latter is severely damaged at high temperature. In practice, when the ITO film is exposed to high temperatures above 300°C, its electrical properties will be affected. The resistance has increased by more than three times.
Indium tin oxide (ITO) films are widely used as transparent electrodes in optoelectronic devices. Including liquid crystal displays, plasma display panels and solar cells. Although the ITO film shows transparency and conductivity at high room temperature, the latter is severely damaged at high temperature. In practice, when the ITO film is exposed to high temperatures above 300 °C, its electrical properties will be affected. The resistance has increased by more than three times.
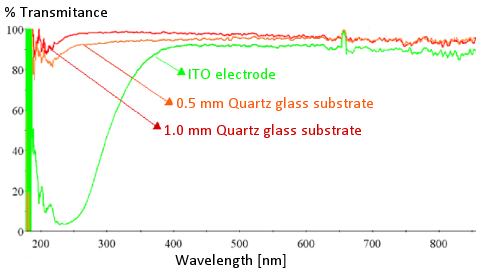
Fig. 2-3. The light transmittance of the ITO electrode on the quartz substrate is compared with the 0.5 mm and 1 mm quartz substrate.
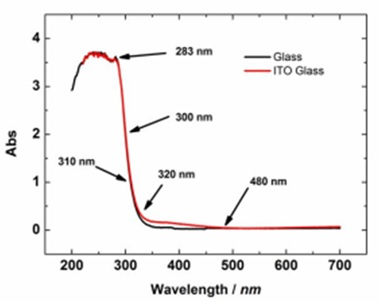
Fig. 2-4. Comparison of the absorption spectra of the ITO electrode on the glass substrate and the glass substrate.
Fig. 2-3. shows the light transmittance comparison between the ITO electrode on the quartz substrate and the 0.5 mm, 1 mm quartz substrate. The light transmittance of the quartz substrate decreases slightly as its thickness increases. It can be seen that the ITO on the quartz substrate transmits light in the visible light range, and light in the ultraviolet range cannot pass. It is difficult to measure the absorption spectrum in the ultraviolet region.
Figure 2-4 shows the comparison of the absorption spectra of the ITO electrode on the glass substrate and the glass substrate. It can be seen that for the ITO electrode, there is no obvious difference between the absorption spectrum shape of the quartz substrate and the glass substrate.
3. Pt and Au Thin film transparent electrode
The main disadvantages of the above-mentioned metal oxide electrodes are the poor reproducibility and high resistance of the electrodes, and they are only suitable for research in the visible light range. They are later replaced by vacuum sprayed Pt and Au thin films (<5000 angstroms), which can be properly prepared. These films have good mechanical stability, low resistance and reasonable light transmittance.
The film manufacturing steps are as follows.
- Strictly clean the transparent substrate surface (glass or quartz), and then ion bombard the substrate surface under vacuum to ensure good adhesion of the metal film on the substrate.
- On the substrate coated with Bi and Pb in advance, gold is deposited in a high vacuum, and the thickness of the film is controlled by controlling the deposition time.
- Control temperature annealing to change the conductivity and light transmittance of the film.
The deposition of Pt film is similar to this, the difference is that Pt can be sprayed directly on the substrate. The Pt film is mechanically stable. When the film is oxidized or polarized for a few seconds at the potential of hydrogen evolution, or when mercury is electrochemically reduced to the surface of the Pt film, the Pt metal is easily detached from the substrate, but through normal cleaning, heated in concentrated nitric acid for a few seconds, immersed in hydrochloric acid for 12 hours or in contact with metallic mercury, but does not fall off from the electrode surface.
The gold film with similar impedance has higher light transmittance than Pt film in the visible light range. Since gold has lower adhesion on the substrate than Pt, a layer of oxide metal oxide is deposited on the substrate in advance. For example, the bismuth oxide substrate has better mechanical stability and lower impedance while changing the light transmittance. Attempts have also been made to reduce the impedance of the Pt film by using a substrate method, but the film prepared in this way is similar to non-transparent, especially with higher impedance. This impermeability may be due to the difference in refractive index between Pt and metal oxide. The Au film is also not easy to fall off unless it is brushed, immersed in hydrochloric acid, nitric acid, or polarized as early as at particularly positive and negative potentials.
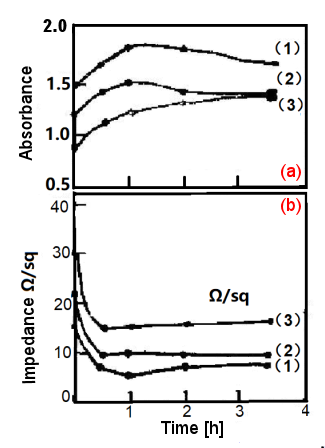
Fig. 2-5. The effect of annealing time on Pt film (glass substrate)
(a) Absorbance-time, (b) Impedance-time; annealing temperature 560 °C2-3)
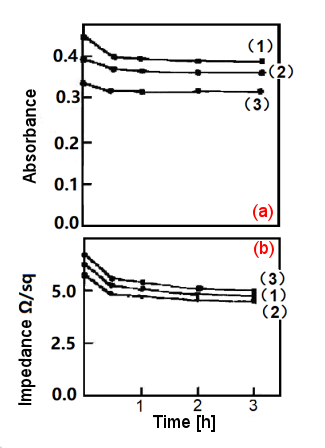
Fig. 2-6. The effect of annealing time on Au film (PbO2 on glass substrate).
(a) Absorbance-time, (b) Impedance-time; annealing temperature 200 °C2-4)
The resistance of these films can be reduced by about 10% to 30% by annealing in a muffle furnace. This artificial aging process may cause the discontinuous metal islands on the surface of the substrate to condense into a more continuous metal film, which reduces the resistance and improves mechanical adhesion and light transmittance, especially in the case of gold films. Fig. 2-5. shows the effect of annealing time on Pt film (glass substrate). It can be seen that the impedance decreases sharply at the beginning and reaches a normal value after 1 hour. In most cases, the impedance decreases by about 55% to 66%, and the permeability of the film lightness, gradually decreases with the annealing time. For the Au films on bismuth or lead oxide and ground in Fig. 2-6., the impedance and absorbance both decrease with annealing time.
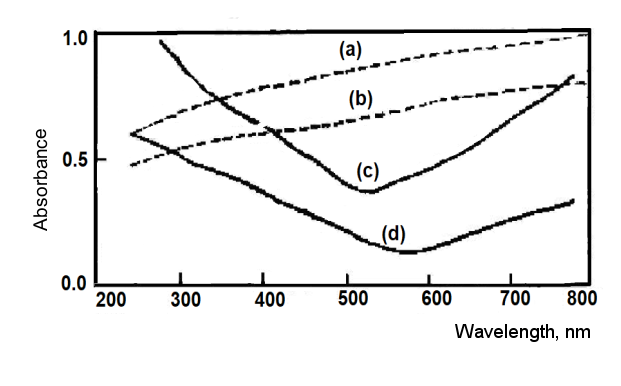
Fig. 2-7. Absorption spectra of various films on quartz substrate.)
Fig. 2-7. shows the absorption spectra of various films. The absorbance of Pt film is approximately linear in the wavelength range of 250 to 800 nm, while the absorption spectrum of gold film has a minimum at a wavelength of about 550 to 650 nm. When these metal films are deposited on a quartz substrate, the optically transparent electrode can be used for research in the ultraviolet region. Except that the overpotential of hydrogen ion discharge on the Pt thin film electrode is slightly lower than that of the bulk Pt electrode, the electrochemical properties of the gold thin film electrode are very similar to the bulk electrode.
Click to watch this lecture
References:
2-1) T. Kuwana and N. Winograd in Electroanalytical Chemistry, A. J.Bard. Ed., vol. 7, Marcel Dekker, New York, 1974.
2-2) N.R. Armstrong, A.W.C. Lin, M. Fujihira and T. Kuwana, Anal. Chem., 48, 741 (1976).
2-3) R. Cielinski and N. R. Armstrong, Anal, Chem., 51, 565 (1979)
2-4) W. von Benken and T. Kuwana, Anal. Chem., 42, 1114 (1970).
Chapter III - Optically Transparent electrode (Part 2)
This article will continue to introduce Hg-Pt, carbon film transparent electrode, metal grid electrode, porous glassy carbon electrode and porous metal electrode, and thin film grid electrode (Pt, Au, C).
1. Hg-Pt and carbon film optical transparent electrode
1.1 Hg-Pt film electrode - Expanding the cathodic potential region of the electrode
Sometimes, in order to expand the cathodic potential area of the electrode, electrochemical reduction of mercury ions on the surface of the Pt film optically transparent electrode can be used to form a thin mercury surface by electroplating, which increases the available cathodic potential range (about 300-400 mV negative shift) due to the large overpotential of hydrogen discharging on the surface of the mercury. By limiting the amount of deposited mercury a certain amount of light transmission can be retained. The mercury film is generally about 50 angstroms thick, and even thicker it will form mercury droplets.
This mercury-plated electrode allows the optical monitoring of metal deposition on the mercury film electrode and electrode reactions involving the loss of mercury from the electrode, in addition to the study of electrode reactions with negative potentials.
1.2 Carbon film electrode
Carbon film electrodes can be prepared by vacuum deposited carbon films on a quartz glass or germanium substrate. If the substrate is heated to 450 degrees before deposition, a better electrode can be obtained3-1). The thickness of the film is 280 - 310 angstroms. This electrode presents a larger resistance compared to the metal film electrode. In addition, its electrochemical properties are similar to those of the usual graphite electrodes. The carbon film optically transparent electrode on a quartz substrate has good light transmission in the entire ultraviolet-visible light range.
2. Metal grid electrode
In 1967, R. W. Murray et al. reported a use of a simple metal grid optically transparent electrode to observe the electrolysis process and the spectral changes of the electrochemical cell after the reactants were completely consumed3-2) - 3-4). The metal grid electrode used was a very fine metal micro grid prepared by an electrochemical deposition step shown in Figure 3-1. The 1000 mesh Au micro mesh optically transparent electrode was used in a thin layer electrochemical cell for spectroelectrochemical measurements. The light transmittance of the 1000 mesh Au micro-mesh used is about 45%, and the mesh is 17.6 µm (the light transmittance of 500 mesh is 60%, the mesh is 39 um, the light transmittance of 2000 mesh is 22%, and the mesh is 6.3 µm). The size of the Au micro mesh electrode in the figure is 1 x 3 cm. The micro mesh was sandwiched between two pieces of glass or quartz glass, each of which was previously coated with adhesive around its perimeter. A narrow strip (at the thick black line) was used as a spacer and bonded with moderate pressure. Then a generous amount of adhesive is applied to the edges of the sandwich sheets to ensure a tight seal and placed in a dry place to dry for a period of time before use. The bottom opening of the thin layer cell allows contact with the specimen solution, reference electrode and auxiliary electrode. The electrodes are connected at the conductive end of the electrode at B. The electrode is now designed for easy replacement of the internal solution, which is characteristic of the spectroelectrochemical flow cells used today. Using this thin layer cell, measurements of spectral changes during the oxidation of 3,3'-dimethylbenzidine were successfully performed. The time course of the absorption variation at 438nm was recorded.
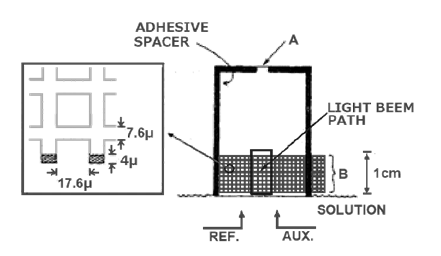
Fig. 3-1 Optically transparent electrochemical cell using gold grid electrodes3-2)
(The left side shows the size of 1000 mesh Au grid).
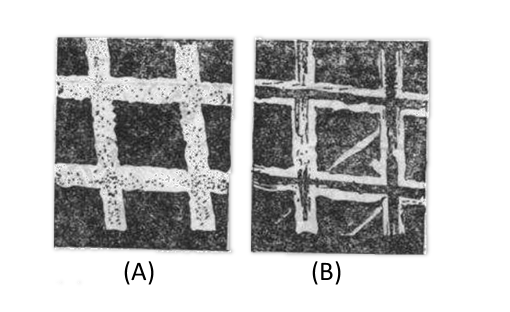
Fig. 3-2 Scanning electron microscope photograph of 500-lpi gold mesh grid (x 1000x)
(A) Dark side (B) Glossy side3-6)
The advantage of metal grid electrode is that it serves as an electrode with very good conductivity, and at the same time has high light transmittance and an unrestricted spectral range. Fig. 3-2 shows a scanning electron microscope photo of a gold grid with a bright surface near the original grating during electrodeposition. Pt grid is not suitable for preparation by electroplating and requires the use of coarsely woven Pt grid3-5). The light transmittance of the grid is due to the micropores in the metal, the metal framework is non-transmissive and the light transmission remains essentially constant throughout the UV-Vis-IR range, therefore, using grid optically transparent electrodes, the optical properties of the spectroelectrochemical cell are those of other optical cell elements supporting the electrolyte and solvent, which makes mesh grids electrodes very useful in a wide spectral range.
2.1 Gold grid electrode characteristics
The electrochemical properties of the metal grid electrode are basically similar to those of the metal electrode, so the gold grid electrode presents the positive and negative potential range of the bulk gold electrode.
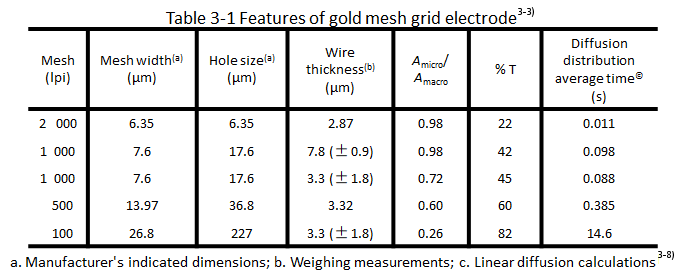
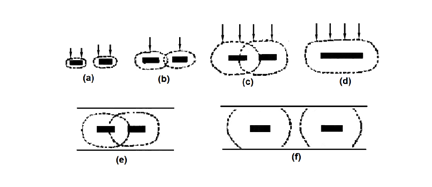
Fig. 3-3 Diffusion characteristics of grid electrode.
The homogeneous geometry of the grid gives a "double feature" in terms of the diffusion of the electroactive material to the electrode, which is manifested in a short time after the potential step to a single wire. As shown in Fig. 3-3-a, the effective electrode area is therefore the microscopic area of the mesh (A micro). After a shorter period of time (depending on the spatial dimensions of the mesh) the diffusion layers overlap each other as in Fig. 3-3-b. Then the electroactive material in the holes in the mesh undergoes completely depleting electrolysis as in Fig. 3-2-C. The arrows indicate the direction of diffusion of the electroactive material, the same as on the flat electrode in Figure 3-2-d. The diffusion is effective for the total two-dimensional area of the mesh or a few geometric (macro) areas (A macro) is effective. The closer the mesh is, the faster the diffusion layers overlap, so in the timed current experiments under semi-infinite diffusion conditions, the apparent electrode area obtained from it 1/2 from the calculation gradually changes from a shorter time micro value to a longer time macro value, and the transition time from A micro to (A macro) is also shown in Table 3-1 Diffusion distribution averaging time for different apertures of the metal mesh The time for the electrode to reach near planar electrode diffusion depends on the hole size shown in Table 3-1.
If the mesh is sufficiently tight with respect to the thin layer of solution shown in Fig. 3-2 (e), the grid electrode can be approximated as a planar electrode after a short period of time in the thin-layer pool word conformation, while the made grid requires a long electrolysis time to reach planar diffusion, as shown in Fig. 3-2 (f). If it is also used in thin layer spectroelectrochemistry, it will inevitably produce exhaustive electrolysis of the electroactive materials in the cavity. In principle, it is inappropriate to deal it by semi-infinite diffusion at this time.
2.2 Mercury grid electrode
Mercury grid electrode is also prepared by electrodepositing thin film of accumulated mercury on Ni, Au-grid substrates3-6) - 3-7). Fig. 3-4 show thin iE curves describing the negative potential limit of different grid electrodes and hanging mercury electrodes (0.1 mol/L HCl, 0.5 mol/L KCl 3-6) ). Since the mercury film slowly dissolves the Au substrate while producing gold amalgam on the electrode surface, the grid electrode must be re-plated daily in order to maintain the maximum hydrogen overvoltage, and one (200 rods/cm) Au grid electrode can withstand 10-30 mercury plating cycles.
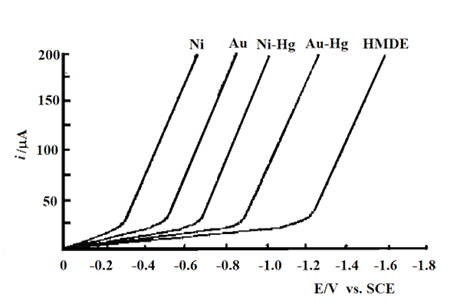
Fig. 3-4 Thin-layer voltammograms describing the negative potential limits of different grid electrodes and mercury grid electrodes.
2.3 Comparison of transmittance and impedance of different light transmitting electrodes
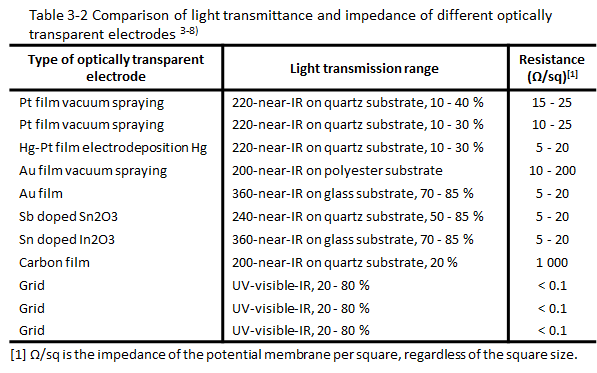
The grid electrode is mainly used to compare the optical and electrical parameters of the light transmitting electrode in the light transmitting thin layer spectroelectrochemistry. Table 3-2 shows the comparison of transmittance and impedance of different light transmitting electrodes. It can be seen that the light transmission spectrum range of the grid electrode is larger, and the electrode impedance is lower. The advantage of the metal grid electrode is that it serves as an electrode with very good conductivity, and at the same time has high light permeability, can be bent into different geometric shapes and unlimited spectral range. One of its disadvantages is the non-transmission of metal wires. It hinders the observation of adsorption phenomenon with perpendicular incidence of luminosity. Another disadvantage is the complicated diffusion behavior in spectroelectrochemical experiments in a short time.
2.4 ALS gold and platinum wire gauze working electrode
ALS provides customers with two kinds of gold and platinum mesh electrodes. The gold mesh grid is 100 mesh, and the platinum mesh mesh is 80 mesh, which means the number of holes per square inch (2.54 mm) on the screen, and 50 mesh means that there are 50 holes per square inch (2.54 mm). The higher the number of mesh, there are more holes , and the lower the light transmission rate. 80 mesh platinum wire mesh working electrode light transmission rate is about 50%-55%. The presence of contaminants on the mesh will affect the light transmission rate and electrochemical reaction characteristics.
The cleaning method of metal wire gauze electrode: 1) electrochemical cyclic voltammetric scanning cleaning method in sulfuric acid; 2) ultrasonic cleaning method; 3) if there is no ultrasonic cleaning equipment, you can try to use cotton swab + polishing solution (PK- 3) to clean the metal wire gauze electrode. The method is convenient and quick, and can effectively clean the surface of wire gauze electrode in a short time (it is only useful if it is slightly dirty).
3. Porous glassy carbon electrode and porous metal electrode
Reticulated Vitreous Carbon (RVC) is a glass-like carbon with 97% void volume and porous structure, as shown in Fig. 3-6. RVC can have different porosity, and when cut into thin slices, their light transmission is comparable to that of mesh grid electrodes (for 1.2-0.5 mm thick 40-hole RVC. T = 13-45%), is essentially constant throughout the UV-visible spectrum, and can achieve complete electrolysis of the active material in a very short time because the majority of the solution is inside the porous electrode 3-9). Such electrodes are fragile and require special care during operation. Foam-type metallic materials such as nickel porous metal foams can also be cut into thin slices for use as optically transparent electrodes. The above porous electrodes are prepared for easy light transmission and light range length, which can be adjusted within a certain range by selecting different pore sizes and different thicknesses of materials. Optically transparent electrodes made of porous materials are most suitable for measuring samples with weak light absorption and are also mainly used to form thin layer cells due to their complex diffusion behavior in a short time.
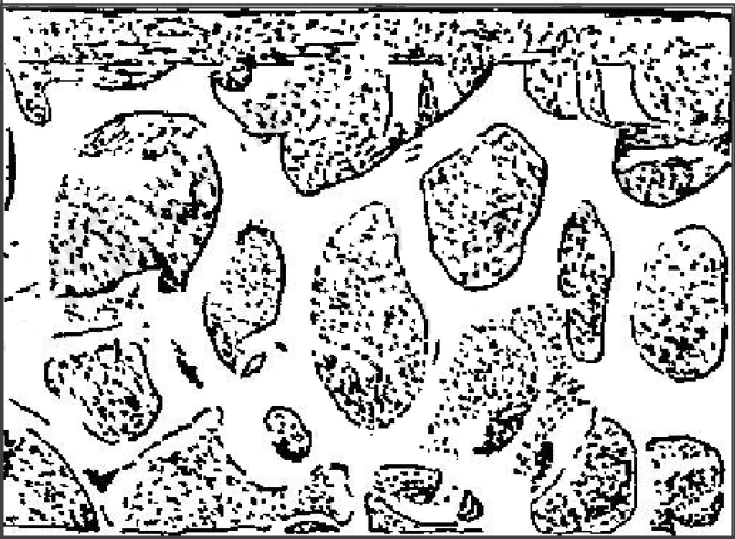
Fig. 3-5 Scanning electron microscope photo of Au-RVC electrode3-10)
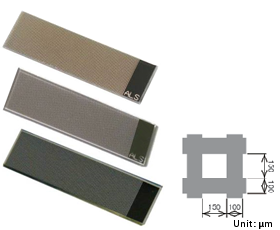
Fig. 3-6 ALS thin film grid electrode.
4. Thin film grid electrodes (Pt, Au, C)
Finally, we introduce a modified thin film optically transparent electrode - thin-film grid electrode. In the previous article, we introduced that ITO optically transparent electrodes can be used for spectroelectrochemical flow cell measurement. But from the point of view of optical properties; the light transmittance of ITO optically transparent electrode in the visible light region is as good as 70%-85%, but it absorbs ultraviolet light and cannot be used for spectrum measurement in the ultraviolet range. Although Au and Pt film electrodes based on quartz glass can be used for measurements outside the ultraviolet range, the lower light transmittance of the electrodes, about 10%.
In order to improve the light transmittance of the metal film electrode, a grid electrode of Au, Pt and C materials suitable for spectroelectrochemical flow cells was fabricated using lithography technology (Fig. 3-6). ALS provides customers with grid electrodes of three electrode materials, which are mainly used in spectroelectrochemical flow cells. When using, simply clip the grid electrode into the flow cell and place the flow cell into the SEC2020 spectrometer system, and spectroelectrochemical flow cell measurements can be easily performed.
Click to watch this lecture
References:
3-1) T. P. De Angelis, P.W. Hurst, A. M. Yacynyh, H. B. Maek, W. R. Heineman and J. S. Mattson, Anal. Chem., Vol.49, No.9, 1395-1398 (1977).
3-2) R. W. Murry, W. R. Heineman and G. W. O'Dom, Anal, Chem., Vol. 39, No.13,1666-1668 (1967).
3-3) M. Petek, T. E. Neal and R. W. Murray, Anal, Chem., Vol. 43, No.8, 1069-1074 (1971)。
3-4) W. J. Blaedel and S. L. Boyer, Anal. Chem., Vol.45, No.2 , 258-263(1973).
3-5) D. Lexa, J. M. Saveant and J. Zickler, J. Am. Chem. Soc., Vol.99, No.8, 2786-2790 (1977).
3-6) M. L. Meyer, T. P. De Angelis and W. R. Heineman, Anal, Chem., Vol.49, No.4, 602-606 (1977).
3-7) W.R. Heineman, T. P. Deangelis and J. F. Goeiz, Anal. Chem., Vol.47, No.8, 1364-1369 (1975).
3-8) T. Kuwana and W. R. Heineman, Acc. Chem. Res. Vol. 9, No.7, 241-248 (1976).
3-9) J. W. Sorrels and H. D. Dewald, Anal, Chem., Vol. 62, No.15, 1640-1643 (1990).
3-10) D. E. Hobart, V. E. Norvell, P. G.Varlashkin, H. E. Hellwege and J. R. Peterson, Anal. Chem., Vol. 55, No.9, 1634-1637(1983).
Chapter IV - Optically transparent thin layer spectroelectrochemistry (Part 1)
Determination of cell potential E0' and electron transfer number n
1. Reversible reaction
For a reversible reaction system, the electrode potential can be expressed by the Nernst equation.
Ox + ne ⇔ Red
At 25℃, the Nernst equation can be expressed as:
E = EO' +(0.05916/n) lg(COx/CRed)
When a potential is applied to the system, in order to satisfy the above equation, a redox reaction takes place on the surface of the electrode, resulting in an electric current. Although the potential applied controls the concentration ratio of the substance (COx/CRed)surf at the electrode surface, the concentration ratio of the substance (COx/CRed)sol in the solution is quickly adjusted to the same ratio as at the electrode surface due to the thin layer of solution in the thin cell.
The time to equilibrium depends on the thickness of the thin layer of solution, generally for thin layer cells with a thickness of less than 0.2 mm, electrolysis reaches equilibrium when the current decays to a minimum value, usually within 60 sec. Therefore, the potential E can be plotted against log(COx/CRed) to obtain a straight line, according to the slope of the line can be found the number of electron transfers n. The E0' can be obtained from the intercept of the line on the potential axis, and as the current through the electrode is very small when equilibrium is reached, the effect of the IR drop can be ignored and the E0' can generally be determined to a few mV.
The reversible system, potassium ferricyanide, is illustrated below as an example. Fig. 4-1 shows the absorption spectrum recorded at different applied potentials. The absorption spectra were recorded at different applied potentials, starting at 0.4 and waiting for complete equilibrium after each change in potential. The absorption value at 420 nm was chosen as a measure of potassium ferricyanide and potassium ferricyanide.
Set at this wavelength, Molar extinction coefficient of ferricyanide: εOx, Molar extinction coefficient of ferrocyanide: εRed, Thin layer cell path length: d, Ferricyanide ([Fe(CN)6]3-) initial concentration: C*
Absorbance when completely reduced: ARed = εReddC*
Absorbance at an arbitrary intermediate potential:
Ai = (εOxCOx +εRedCRed)d
When there is no chemical reaction: COx+ CRed = C*
According to equations 4-3 to 4-7, we can get
COx =(Ai -ARed) / [d (εOx- εRed)]
CRed = (AO -Ai) / [d (εOx- εRed)]
Substituting the above two equations into equation (4-2)
E = EO’ +( 0.05916/n) lg{r(E)}
COX /CRed= r (E) = [ (Ai -AR) /(AO -Ai)]
(4-5)
(4-6)
(4-7)
(4-8)
(4-9)
(4-10)
(4-11)
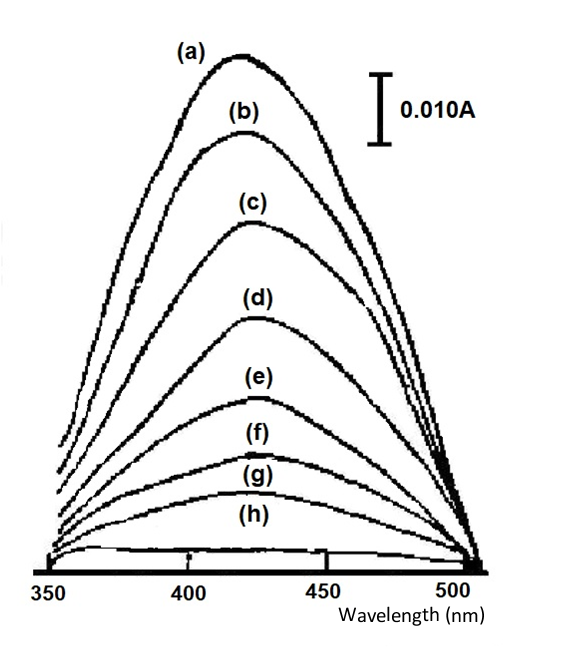
Fig. 4-2 shows a straight line from a Nernst plot for the K3FeCN6 system with a slope of 59.6 mV and a calculated electron transfer number n = 0.99, corresponding to a single-electron electrode reaction. From its intercept, the measured potential EO’ = 0.275 V vs. SCE (standard calomel electrode) has a standard deviation of 0.001 for four measurements, which is basically in line with the value reported in the literature. The important thing in this experiment is that when the measurement is performed, the solution should be balanced with the electrode potential and all light absorption changes should stop. Only a small residual current and a small current generated by the edge effect pass through the working electrode.
1mol/L K3FeCN6(0.1mol/L KNO3), thin layer cell 0.24mm,
applied potentials (a)0.4, (b)0.32, (c)0.30, (d)0.28, (e)0.26, (f)0.24,(g)0.22, (h) 0.00 V (vs. Ag/AgCl)
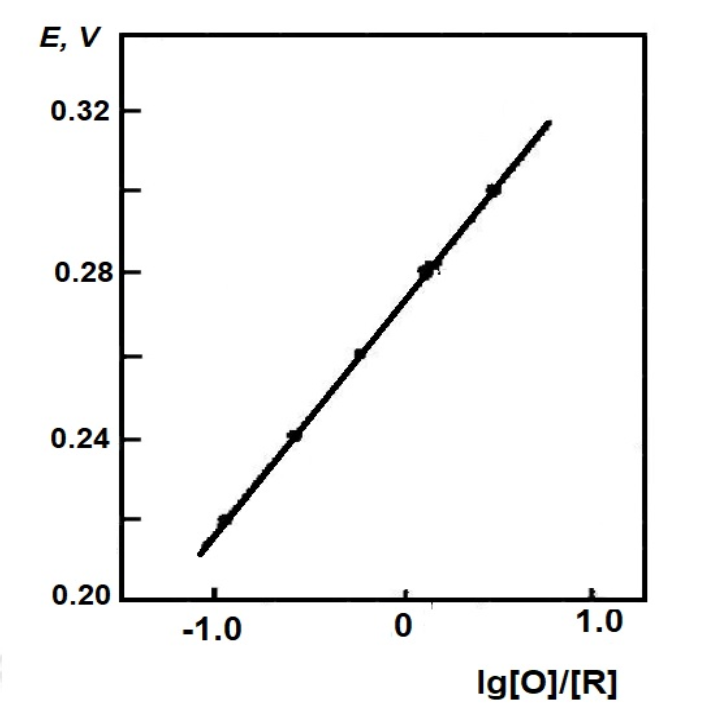
Fig. 4-2 Nernst diagram of the system for the K3FeCN6 system.
2. Quasi-reversible reaction
A typical example of this type of system is the vitamin B12 mentioned in Chapter 1, where the rate of electron transfer in the first electron reduction step is rather slow, even though the reduction wave is barely observed below the slow sweep used in the DC polar spectrum until the potential is sufficiently negative to produce a two-electron reduction wave. Fig. 4 3 shows the cyclic voltammogram for its negative potential sweep. At 0.93V vs. SCE potential, a two-electron reduction peak is shown. In contrast, the thin-layer spectroscopy constant potential experiment shows two consecutive, easily distinguishable one electron reduction steps.
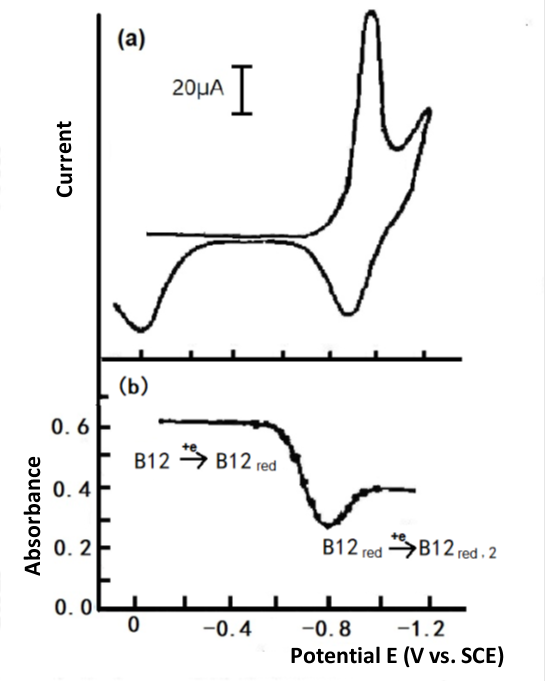
Fig. 4-3 Cyclic voltammetry of 1mmol/L Vitamin B12, Britton-Robinson buffer solution (pH 6.86), Hg-Au grid optically transparent electrode.
(a) Thin layer cyclic voltammetry
(b) Plotting the absorbance at 388 nm versus potential[3].
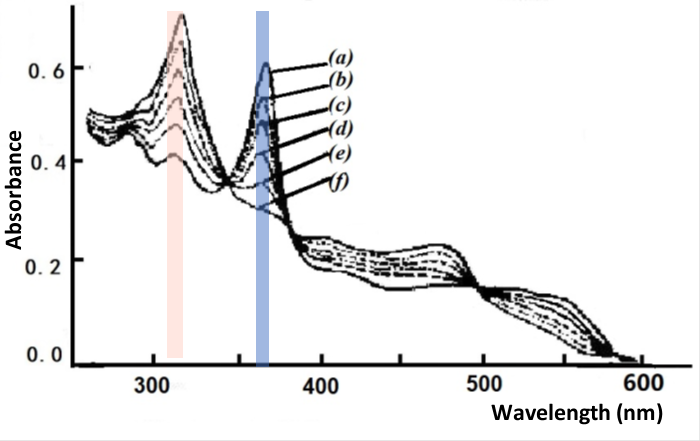
Fig. 4-4 Thin layer spectrum of B12 reduced to B12red.
Applied potential: (a) -0.550, (b) -0.630, (c) -0.660, (d) -0.690,
(e) -0.720, (f) -0.770 V vs. SCE [3].
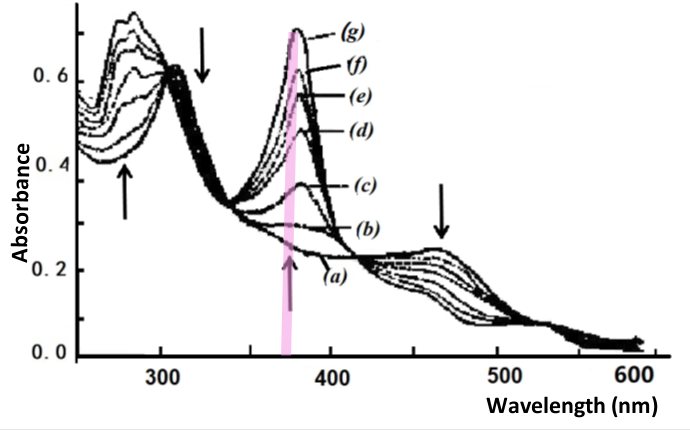
Fig. 4-5 Thin layer spectrum of B12red reduced to B12red.
Applied potential: (a) -0.770, (b) -0.820, (c) -0.860, (d) -0.880,
(e) -0.900, (f) -0.920, (g) -1.000 V vs. SCE [3].
Using a mercury gold mesh grid optical transparent thin layer spectroelectrochemical cell with a progressive potential applied from -0.10 to -1.15 V, two clear changes were observed in the UV-Vis spectrum of the B12 solution, one change occurring in the potential range of -0.58 to -0.75 V, as shown in Fig. 4-4. The starting spectrum at -0.55 V is derived from the initial B12, characteristic of Co(III), with an absorption band at wavelengths from 350 to 360 nm; a gradual step towards negative potentials most produces the absorption spectrum of B12 at -0.77 V, for example Co(II), and Nernst plotting using absorbance data at 360 and 311 nm indicates that the spectral change corresponds to a one electron reduction process with E1/2 = -0.655 V.
The second spectral change occurs in the potential range of minus 0.77 to -0.95 V. For example, as shown in Fig. 4-5, the starting spectrum at -0.770 V is that of B12, example Co(II), which gradually steps towards the negative potential to produce a spectrum of B12, monovalent cobalt, at -1.000 V. The absorbance data at 368 nm were plotted by Nernst to show that this change in absorbance also corresponds to a one electron reduction process with the formula potential E1/2 = -0.880 V.
3. Biological redox system using mediators
Many biological substances such as hemoglobin and myoglobin have a very slow direct heterogeneous electron transfer rate at the electrode. This behavior is usually due to their strong adsorption on the electrode surface and the fact that the electroactive centre is surrounded by their polypeptide chains, and these biological substances are difficult to study using the usual electrochemical methods. For such systems, the usual method is to add a mediator to the solution to regulate the electron transfer between the electrode and the biological component, based on the principle that:
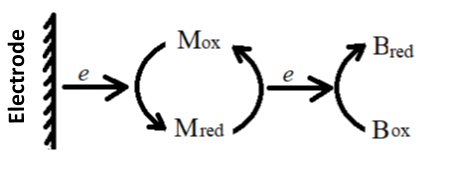
(4-12)
E = EO’B + (RT/nBF) ln{[OB]/[RB]
(4-14)
In the formula, M and B represent mediators and biomolecules, respectively. According to the applied potential and the ln{[OB]/[RB]} obtained by light absorption, make a Nernst diagram similar to the equation (4-10) to obtain EO’B and nBvalue.
For some biological systems, it is very important to measure EO’ to control the solution potential through the redox of the mediator and biological components. For example, in the absence of a medium, it takes several hours to electrolyze cytochrome C in an optically transparent thin layer cell, but only a few minutes with a suitable medium.
The basic requirements for selecting a mediator are: The mediator must quickly and reversibly exchange heterogeneous electrons with the electrode and transfer homogeneous electrons with biomolecules. Stable in both the oxidised and reduced states. Its spectrum does not overlap with the spectrum of biological components.
The thin-layer spectroelectrochemical method can also be used to easily determine the thermodynamic function of the system. The thermodynamic parameters ΔS0 and ΔH0 can be obtained from the variation of the equation potential EO’ with temperature by measuring the E - lg([O]/[R]) relationship curve for the same system at different temperatures.
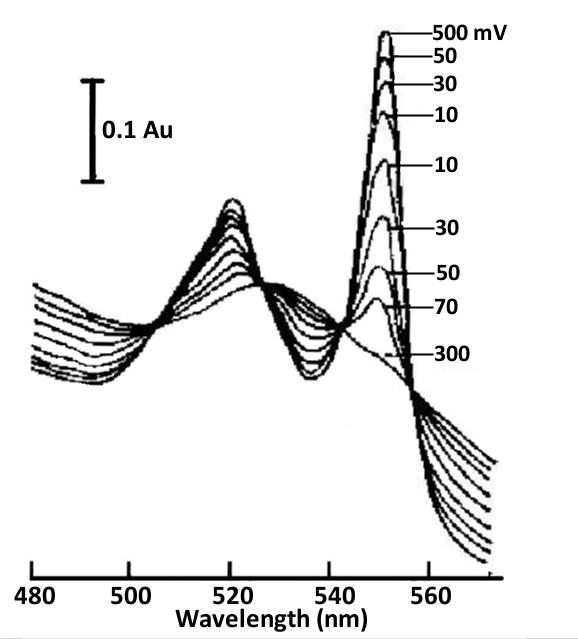
Fig. 4-6 Thin layer spectra of cytochrome C and 2,6-dichloroindophenol (DICP) mediators under different applied potentials, 0.5 mol/L phosphate buffer (pH 7.0) [4].
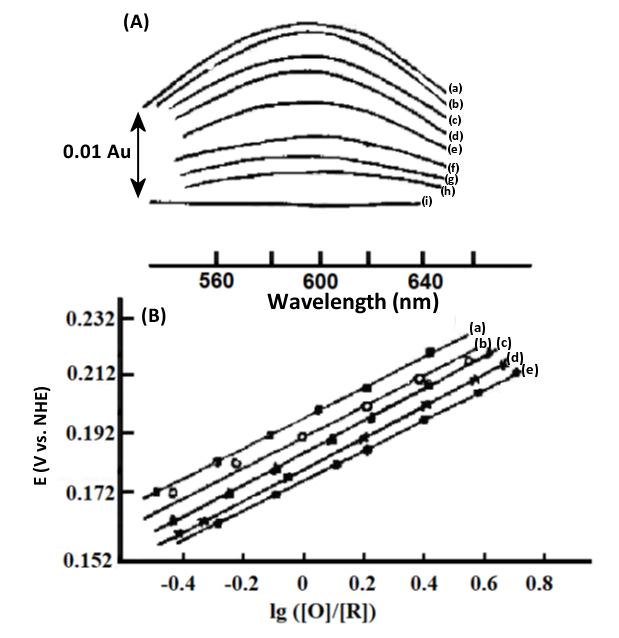
Fig. 4-7 (A) Thin-layer spectra of stellate anthocyanins at different applied potentials.
2.7×10⁻⁸ mol/L stellate anthocyanin and 2.8×10⁻⁸mol/L Ru(NH3)Py3+, thickness 0.021 cm, applied potential∶ (a) 240; (b) 230; (c) 220; (d) 210; (e) 190; (f) 175; (9) 150; (h) 145; (i) 90 mV vs. NHE.
(B) Nernst diagram at different temperatures[5].
ΔH0 = -nFEO' + ΔS0
Nernst diagram at different temperatures.
EO’ = 184 (±1 mV) vs. NHE (25℃)
ΔH0 = -71 (±4) kJ/mol
ΔS0 = -44 (±3) e.u.
(4-16)
Click to watch this lecture
Reference
[1] Song Shihua, Cheng Guangjin, Dong Shaojun, Analytical Chemistry, 15, 461 (1987).
[2] T. M. Kenyhercz, T. P. DeAngelis, B. J. Norris, W. R. Heineman, and H. B. Mark P, J. Am. Chem. Soc., 1976, 98, 9, 2469–2477
[3] Kenneth A. Rubinson, Eiki. Itabashi, and Harry B. Mark, Inorg. Chem., 1982, 21, 9, 3571-3573 .
[4] W.R.Heineman,B.J.Norris and J. F. Gaelz, Anal. Chem., 1975, 47, 1, 79–84.
[5] N. Sailasuta,F. C. Anson and H. B. Gray,J. Am. Chem. Soc., 1979, 101 (2), 455-458.
Chapter V - Optically transparent thin layer spectroelectrochemistry (Part 2)
Non-ideal behavior of the Nernst plots
Ideally, the Nernst plot of E against lg{r(E)} should be a straight line, and this is the case for many systems, but in some cases deviations from a straight line have been observed, one of which is due to the overlap of the spectra of two or more redox substances in the solution being analyzed and the change of each spectrum within the potential range under study The second is the synergistic or interrelated nature of the different redox centers, which will be discussed separately below.
1. Spectrally overlapping, chemically uncorrelated redox systems
Considering the simultaneous existence of several uncorrelated redox systems in the solution, the Nernst equation for the half reaction of component i can be expressed as:
Fig. 5-1 shows lg{r'(E)} plotted against E for a two component system with different redox stoichiometry and spectral behavior. For comparison, the range of potentials added and the two-form redox potentials are concentrated around 0 mV, and the effects of having different formula redox potentials (E1o', E2o') are shown in Figure 5-1(A). As expected, when θ1 = θ2 ie the two components have the same stoichiometric potential and electron transfer number, the resulting Nernst plot (curve a) is a straight line with a slope of 2.303RT/AF.
However, when θ1 is not equal to θ2, it deviates from linearity. The greater the difference between the two equations, the more obvious the deviation. Therefore, according to the usual Nernst plot, fitting these data (θ1 = θ2) as linear will produce measurement errors in E1o' and x, as per the usual Nernst plotting, where the intercepts of the extensions of the two straight line section s on the y-axis give the equation volume potentials of the two electrochemical redox pairs, respectively, with the slope of each straight line region represents the number of electron transfers per electrochemical redox pair.
Fig. 5-1(B) shows the influence of different electron transfer numbers on the simulated Nernst diagram < n1 = 1, n2 = 2), even though it has the same formula and potential difference ΔEo' as the above Fig. 5-1(A) And ΔAi value, but the shape of the curve is quite different. Fitting these simulated responses according to the conventional Nernst plot will produce greater deviations in the measured values. The slope and intercept of the two linear parts in the figure can be used to obtain the respective equation potential and the number of electron transfers.
Fig. 5-1 (A) The influence of different absorbance change ratios on the simulated Nernst plots.
The parameters used in the simulation are: E1o' = 0 mV,E2o' = 0 mV(curve a); E1o' = -25 mV,E2o' = 25 mV (curve b);E1o' = -50 mV,E2o' = 50 mV (curve c); E1o' = -75 mV, E2o' = 75 mV (curve d); n1 = 1, n2 = 1; ΔA1 = 1, ΔA2 = 1
(B) The influence of different electron transfer numbers on the simulated Nernst plots.
The parameters used in the simulation are E1o' = 0 mV, E2o' = 0 mV (curve a); E1o' = -25 mV, E2o' = 25 mV (curve b); E1o' = -50 mV, E2o' = 50 mV (curve c); E1o' = -75 mV, E2o' = 75 mV (curve d); n1 = 1, n2 = 2, ΔA1 = 1, ΔA2 = 1 [5-1]
Fig. 5-1 (A) The influence of different absorbance change ratios on the simulated Nernst plots.
The parameters used in the simulation are E1o' = -75 mV,E2o' = 75 mV;n1=1,n2 = 1;ΔA2/ΔA1: 100(a),10(b),1(c),1/10(d),1/100(e)
(B) The influence of different absorbance change ratios on the simulated Nernst plots.
The parameters used in the simulation are E1o' = -75 mV, E2o' = 78 mV; n1 = 1, n2 = 2; ΔA2/ΔA1:100(a), 10(b),1(c),1/10(d),/100(e)[5-1]
In the redox potential, the voltage is fixed at 0mV, n1 = 1, n2 = 2, and the absorbance is changed, the simulated Nernst plots were very close to a straight line and the data yielded values between 1.0 and 2.0, depending mainly on the magnitude of the contribution of each redox pair to the total absorbance, with the equation amount potential very close to 0 mV.
Fig. 5-2(B) shows the two redox pairs with different electron transfer numbers respectively. In the limit, the slope and intercept of the Nernst diagram are approximately related only to the redox pair with the larger ΔA value, and the respective n and Eo' values can be obtained from the slope and intercept of each asymptote, respectively, when the light absorption of the two pairs does not vary much.
The thin-layer spectroelectrochemical experiments with mixtures of potassium ferricyanide and o-toluidine and their simulated responses are shown in Fig. 5-3 and Table 5-1. Potassium ferricyanide and o-toluidine were chosen because they can represent spectrally overlapping and well characterized spectroelectrochemical systems that are chemically uncorrelated, and in addition, these redox pairs provide convenient experimental pairs for assessing the validity of chemically uncorrelated redox system models.
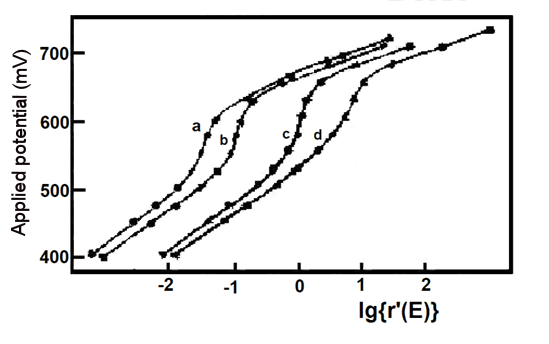
Fig. 5-3 Experimental (**) and simulated (--) Nernst plots for mixtures of potassium ferricyanide and o-toluidine [5-1]

As shown in Figure 5-3, the agreement of the model with the experimental results is evident and the results of the mixture studies for Eo' and n values are also in agreement with the measurements when they are present separately. The average potential and electron transfer number of 663.6 ± 2.3 mV vs. Ag/AgCl for o-toluidine (experiments a, b, c, d) are consistent with the reported values of 659 mV and 1.9, and the results for potassium ferricyanide are also consistent. Finally, if the experimental data in the presence of a single component are analyzed in the two component simultaneous mode described above, the values of Eo' and n for the redox pairs that account for the major component (Table 5-1, Experiments 1', 2') are consistent with the results of the usual Nernst analysis (Table 5-1, Experiments 1, 2), but E2o' and n2 E2o' and n2 in Experiment 1' and E1o' and n1 are nonsignificant. Thus, the five variables (E1o', n1, E2O', n2, ΔA2/ΔA1) can be obtained from the experimental data measured for the mixture.
Reference
[5-1] E. W. Kristonson, D. H. Igo, R. C. Eider and W. R. Heineman, J. Electroanal. Chem.,309,61-72(1991).
Chapter VI - Optically transparent thin layer spectroelectrochemistry (Part 3)
Non-ideal behavior of the Nernst plots
This article continues with the second part of the non-ideal behavior of Nernst plots.
2. Chemically correlated redox couple
- First discuss the competition between two ligands for a given redox pair.
For many redox pairs, the oxidation or reduction involves the substitution of a ligand and, therefore, its reduction potential (EO') is related to the properties of the ligand. To describe this situation, consider the competition between two ligands for the oxidized form of a given redox pair, where the two reactions have the same electron transfer stoichiometry, in which case the half reaction is∶
O-L1 + ne = R + L1 (6-1) O-L2 + ne = R + L2 (6-2)
The Nernst equation for the above reaction is
E = E1O' + (RT/nF)ln{CO-L1/(CRCL1)} (6-3) Rewrite the above two equations asE = E2O' + (RT/nF)ln{CO-L2/(CRCL2)} (6-4) CO-L1 = CRCL1θ1(E) (6-5) In the equation, CL1 and CL2 represent the concentration of free ligands, the equilibrium reaction between the two oxidation states after rearrangement must exist by subtracting equations (6-1) and (6-2).CO-L2 = CRCL2θ1(E) (6-6) The equilibrium constant K for the reaction of Eq. (6-7) can be expressed asO-L1 + L2 = O-L2 + L1 (6-7) K = CO-L2CL1/(CO-L1CL2)
= θ2(E)/θ1(E)
(6-8)Under most experimental conditions, CL1 and CL2 are very excessive and can be treated as constants. According to Beer's law, the total absorbance at any potential isK = exp{n(E1O' - E2O')F/RT} (6-9) Substitute equations (6-3), (6-6), and (6-8) into equation (6-10)A(E) = (εO1CO-L1 + εO2CO-L2 + εRCR + εL1CL1 + εL2CL2)d (6-10) A(E) = (α1CRθ1(E) + εRCR + εL1CL1 + εL2CL2)d (6-11) The total concentration of redox state substances is constantwhich α1 = εO1CO-L1 + εO2KCL2 (6-12) C* = CO-L1 + CO-L2 + CR
= {α2θ1(E) + 1} CR(6-13)
(6-14)Substituting equation (6-13) into equation (6-11), we getα2 = L1 + KCL2 (6-15) The limiting absorbance of the oxidized and reduced states can be expressed asA(E) = (α1θ1(E) + CO}C*d/{(α2θ1(E) + 1} + (εL1CL1 + εL2CL2)d (6-16) AO = (α1/α2)C*d + (εL1CL1 + εL2CL2)d (6-17) AO = εRC*d + (εL1CL1 + εL2CL2)d (6-18) In the case where CL1 and CL2 are significantly over C*, the Nernst plot is still linear, but it should be noted that the resulting interception is not the value of the potential E1O', because of the extra term on the right side of the equation ( 6-30).ln{r(E)} = ln(α2θ1(E)
= n(E - E1O')F/RT + ln{CL1 + KCL2}(6-19)
(6-20)
- Consider the following reversible processo, considering again the electrode process containing two consecutive electron transfers [6-1]
When equilibrium is reached at potential E
O ⇌ P ⇌ R (6-21) CO/CP = exp{(E - E1O')F/RT} (6-22) E1O' and E2O' represent the potential equation of O ⇌ P and P ⇌ R, respectively, since the total concentration remains constantCP/CR = exp{(E - E2O')F/RT} (6-23) The absorbance A(E) for a given wavelength isC* = CO + CP + CR (6-24) A(E) = d(COεO + CPεP + CRεR)
= AO+ d{CP(εP - εO) + CR(εR - εO)}
= AR + d{CO(εO - εR) + CP(εR - εO)}(6-25)
(6-26)
(6-27)which AO = dC*εO
AR = dC*εR(6-28)
(6-29)r(E) = {CO(εO - εR) + CPεP - εR)}/{CP(εO - εP) + CR(εO - εR)} (6-30) Substituting the equations (6-22), (6-23) into equation (6-31) and simplify to obtainr(E) = CP/CR{CO/CP(εO - εR) + εP - εR}/{CP/CR(εO - εP) + εO - εR} (6-31) For convenience, the following dimensionless variables are usedr(x) = (x/θ1δ)[x + (1-δ)θ1]/[x+(θ2/δ)] (6-32) Take the logarithm of both sides of equation (6-32)x = exp(FE/RT)
θ1 = exp(FE1O’/RT)
θ2 = exp(FE2O'/RT)
δ = (εO - εP) + (εO -εR)(6-33)
(6-34)
(6-35)
(6-36)Fig. 6-1 shows several representative Nernst plots using different values of θ1/θ2 and δ. For δ(1-δ) > θ2/θ1, the slope of the curve decreases from 1 at smaller x, passes through a very small value, and then increases to 1 at larger x values, as shown in curves (b) and (c). When δ(1-δ) < θ2/θ1, the slope increases from 1 through an extreme value and then decreases to 1, as shown in curve (e); curve (d) represents the special case of δ(1-δ)=θ2/θ1, where the slope remains constant with a value of 1. For the case where the absorption coefficient of the intermediate P is equal to that of O, δ= 0the slope of the Nernst diagram is connected from 1 with the smaller value of x. Increase to 2 when the value of z is larger, such as curve (a); for the case where the absorption coefficient of P is equal to that of R, that is, δ=1, the slope decreases continuously from 2 to 1, which is represented by curve (f).y(z) = ln{r(x)}
= lnx + ln{x + (1 - δ)θ1} - ln(x + θ(sub(2);/δ) - ln(θ1δ)(6-37)
(6-38)
![Fig. 6-1 Nerst plots for different values of [θ2/θ1, δ] Fig. 6-1 Nerst plots for different values of [θ2/θ1, δ]](https://www.als-japan.com/xdata/technical/Fig.6-1.png)
Fig. 6-1 Nernst plots for different values of (θ2/θ1, δ).
(a) 40, 0; (b) 40, 0.3; (c) 20, 0.5; (d) 4, 0.5; (e) 2, 0.9; (f) 2,1[6-1]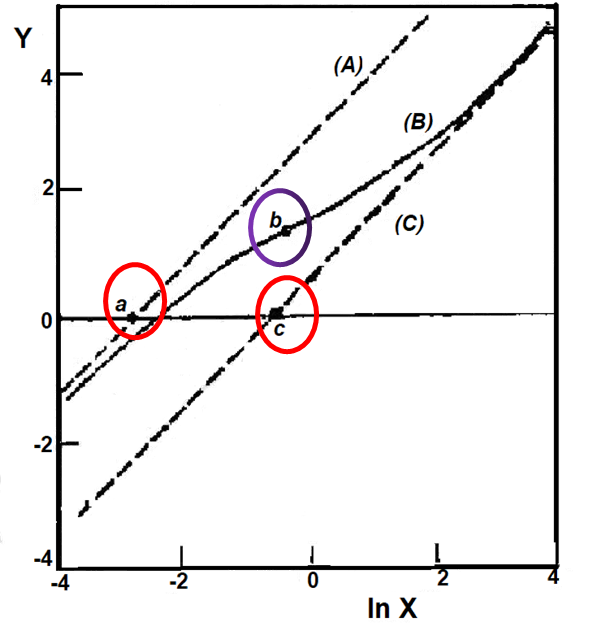
Fig. 6-2 shows the Nernst diagrams of the asymptote, the loading moment and the inflection point.
Curve (B) is Eq. (6-39) and θ1 = 1, lnθ2 = -3,δ = 0.2, asymptote (A) is Eq. (6-40) and (C) is Eq. (6-41) [6-1]
The slope of the above Nernst plot isdy/dlnx = 1 - x/[x + (1 - δ)θ1] + x/[x + θ2/δ] (6-39)
Thus, for 0 < δ < 1 , the slope converges to 1 as x tends to 0 and tends to ∞, as x → 0, the Nernst plot converges to an asymptote with slope 1.When x → ∞, the asymptote isyo(x) = lnx - ln{θ2/(1 - δ)} (6-40) The intersection of the two asymptotes on the horizontal line ln{r(E)} = 0 is given by x = θ2/(1 - δ) and x=θ1δ1, respectively, as shown at points a and c in Fig. 6-2.y∞(x) = lnx - ln(θ1δ) (6-41)
According to the differential equation (6-39), the value of inflection point b in the Nernst diagram is ½ln{θ1θ2(1 - δ)/δ}, ln{(1 - δ)/δ}. The slope of the value of (1 - δ)/δ at a point of the r(x) curve extremum, that is, the minimum slope when θ1θ2(1 - δ)/δ is greater than 1, and the maximum slope of θ1θ2(1 - δ)/δ. Therefore, the value of r(E) experimentally determined at the inflection point, plus the values of the two intercepts of the experimental asymptotic line (a, c) Based on this, we can estimate the values of θ1, lnθ2 and δ.
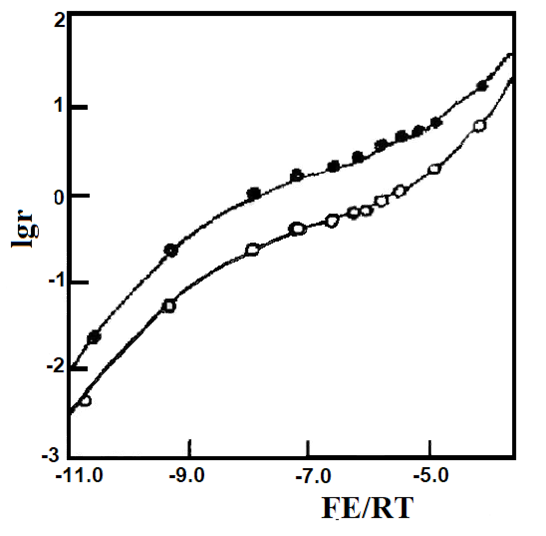
Figure 6-3 Nernst plotting of 1 mmol/L Au(squarate)2- in DMF [6-1].
Measured values at (•) 362 nm and (∘) 364 nm, using a gold raster optically transparent thin layer cell [6-2].
The theoretical curves were obtained based on E1O' = -0.104 V, E2O' = -0.249 V and δ = 0.44 (upper curve) and δ = 0.62 (lower curve).
Fig. 6-3 shows the Nernst plots of 1 mM gold squarate anion [Au(squarate)2]- in 0.5 M TEAP/DMF solution at two different monitored wavelengths (362 nm and 364 nm) through the experimental points the curves were calculated by Eq. (6-38) with E1O' = -0.104 V, E2O' = -0.249 V and the values of δ at different wavelengths, EO' and δ. The exact values were estimated by the above graphing method and then obtained by least squares regression.
Click to watch this lecture
Reference
[6-1] W.T.Yap, G.Marbung, E.A.Blubaugh and R.A.Durst, J. Elecroanal.Chem.and Interfacial Electrochem, 271, 325-329 (1989)
[6-2] E.A. Blubaugh and L.M. Doane, Anal. Chem., 54, 329-331 (1982)
Chapter VI - Optically transparent thin layer spectroelectrochemistry (Part 4)
Non-ideal behavior of the Nernst plots
This article continues with the non-ideal behavior of Nernst plots for non-overlapping spectra and the electrode process for product deposition.
3. Non-overlapping spectra
The above discussed cases are all cases where the spectra of electroactive substances overlap, and the following case will be discussed when only one substance has light absorption [7-1].
a) For backward reaction (EC mechanism)
B ⇔ C
(7-2)
= EOA/B' + (RT/nF) ln(1 + K) + (RT/nF) ln[CA/(C* - CA)]
(7-7)
b) For forward reaction (CE mechanism)
For these systems mentioned above, which affect only the equilibrium concentrations of reactants and products, but not other electrochemical reactions, it is still possible to obtain n from the slope of the Nernst plot, but its intercept does not correspond to its equation potential.
c) Electrode process with two consecutive electron transfers (EE mechanism)
For the electrode process containing two consecutive electron transfers, already discussed in the previous paper.
CP/CR = exp[(E - E2O')F/RT]
(6-23)
d) For ECE mechanism
The Nernst plots are generally nonlinear for such systems where there are other electrochemical processes that affect the equilibrium concentration of the monitored substances.
4. Electrode process of product deposition
Consider the thin layer cell containing only the oxidizing substance O at the beginning, the concentration is CO*, and the initial absorbance of the solution is
When the potential steps to a more negative potential than ES, the concentration of O adjacent to the electrode surface will continue to decrease, and some of the reduced material R will be deposited on the electrode surface, because the concentration of R on the adjacent electrode surface cannot exceed SR, and at equilibrium, its concentration can be expressed by the Nernst equation as (7-21).
= [εOθ(E) + εR]CO*d/[1 + θ(E)]
(7-23)
At the potential of E = ES, CR = SRwe can get
ES = EO* + (RT/nF) ln[(CO* - SR)/SR]
(7-25)
εOθ(E)/[-εOθ(E) + εO]/f - εR)
(when E < ES)
(7-29)
f = SR/C
(7-31)
x = εR/εO
(7-33)
It was found that the laser dye 1-methyl-4(5-phenyl-2-oxazolyl)pyridinium p-toluenesulfonate was strongly deposited on the Au electrode after reduction.
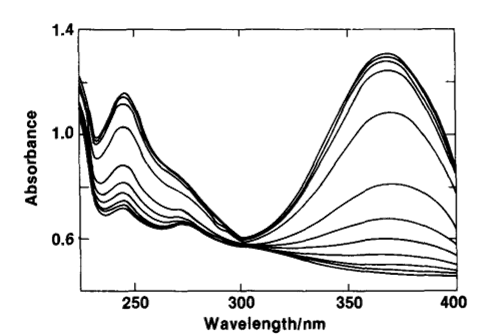
Fig. 7-1 The relationship between the spectrum of the laser dye solution and the applied potential. 1-methyl-4-(5-phenyl-2-oxazolyl) pyridinium p-toluenesulfonate.
Applied potential (from top to bottom): -0.367, -0.900, -0.930, -0.955, -0.975, -0.990, -1.000, -1.010, -1.025, -1.045, -1.070, -1.100, vs. SCE (NaCl ).
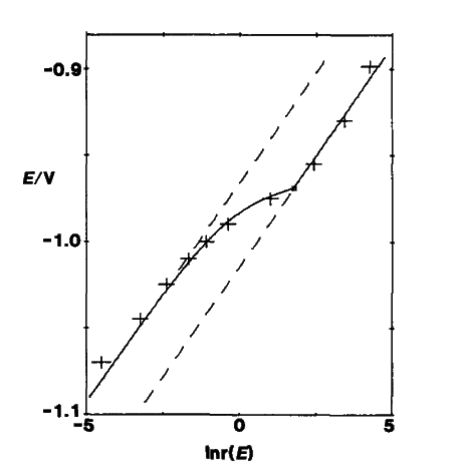
Fig. 7-2 The relationship between E and ln[r(E)].The experimental point measured at a wavelength of 368 nm is indicated by +.The solid line is the theoretical curve of formula (7-33) and formula (7-36), E0 = -1.014 V, SR = 0.35 mmol/L, C*= 2.36 mmol/L. The dashed line is the asymptote of equation (7-34) and equation (7-37).
Fig. 7-1 shows the absorption spectra of 2.36 mmol/L of the dye in 0.4 mol/L KCl aqueous solution at different applied potentials, with an absorption maximum at 368 nm for the oxidized state, which also shows that εR = 0. That is, there is no absorption in the reduced state, but only in the oxidized state.
Fig. 7-2 shows E as a function of ln[r(E)]. The experimental points measured at a wavelength of 368 nm are indicated by +. The solid lines are the theoretical curves of Eqs. (7-33) and (7- 36). The potential pair ln[r(E)] was plotted using the absorbance value at 368 nm, and the measured potential E0 = -1.014 V, SR = 0.35 mmol/L, C* = 2.36 mmol/L [7-2]. The dashed line is the asymptote of Eqs. (7-34) and (7-37).
Click to watch this lecture
Reference
[7-1] S. Dong and Y. Xie, J. Electroanal. Chem. 335, 197(1992)
[7-2] W. T. Yap, E. A. Blubaugh, R. A. Durst and R. T. Burke, J. Electroanal. Chem. and Interfacial Electrochemistry, 160, 73(1984)

