Chapter IV - Optically transparent thin layer spectroelectrochemistry (Part 1)
Determination of cell potential E0' and electron transfer number n
1. Reversible reaction
For a reversible reaction system, the electrode potential can be expressed by the Nernst equation.
Ox + ne ⇔ Red
At 25℃, the Nernst equation can be expressed as:
E = EO' +(0.05916/n) lg(COx/CRed)
When a potential is applied to the system, in order to satisfy the above equation, a redox reaction takes place on the surface of the electrode, resulting in an electric current. Although the potential applied controls the concentration ratio of the substance (COx/CRed)surf at the electrode surface, the concentration ratio of the substance (COx/CRed)sol in the solution is quickly adjusted to the same ratio as at the electrode surface due to the thin layer of solution in the thin cell.
The time to equilibrium depends on the thickness of the thin layer of solution, generally for thin layer cells with a thickness of less than 0.2 mm, electrolysis reaches equilibrium when the current decays to a minimum value, usually within 60 sec. Therefore, the potential E can be plotted against log(COx/CRed) to obtain a straight line, according to the slope of the line can be found the number of electron transfers n. The E0' can be obtained from the intercept of the line on the potential axis, and as the current through the electrode is very small when equilibrium is reached, the effect of the IR drop can be ignored and the E0' can generally be determined to a few mV.
The reversible system, potassium ferricyanide, is illustrated below as an example. Fig. 4-1 shows the absorption spectrum recorded at different applied potentials. The absorption spectra were recorded at different applied potentials, starting at 0.4 and waiting for complete equilibrium after each change in potential. The absorption value at 420 nm was chosen as a measure of potassium ferricyanide and potassium ferricyanide.
Set at this wavelength, Molar extinction coefficient of ferricyanide: εOx, Molar extinction coefficient of ferrocyanide: εRed, Thin layer cell path length: d, Ferricyanide ([Fe(CN)6]3-) initial concentration: C*
Absorbance when completely reduced: ARed = εReddC*
Absorbance at an arbitrary intermediate potential:
Ai = (εOxCOx +εRedCRed)d
When there is no chemical reaction: COx+ CRed = C*
According to equations 4-3 to 4-7, we can get
COx =(Ai -ARed) / [d (εOx- εRed)]
CRed = (AO -Ai) / [d (εOx- εRed)]
Substituting the above two equations into equation (4-2)
E = EO’ +( 0.05916/n) lg{r(E)}
COX /CRed= r (E) = [ (Ai -AR) /(AO -Ai)]
(4-5)
(4-6)
(4-7)
(4-8)
(4-9)
(4-10)
(4-11)
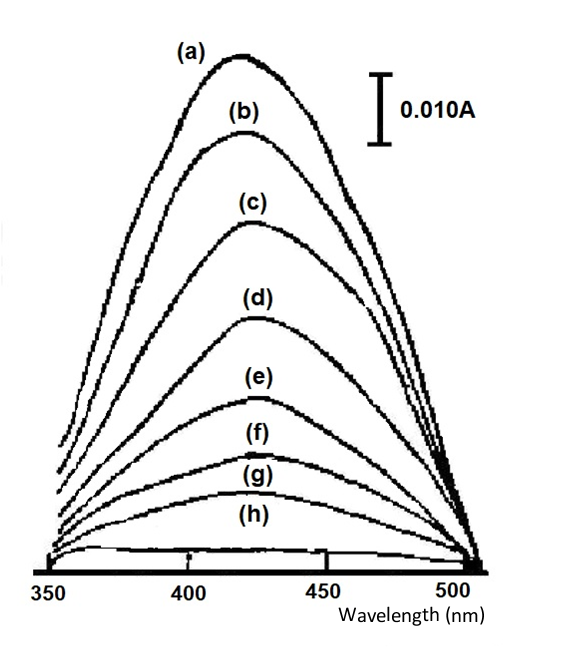
Fig. 4-2 shows a straight line from a Nernst plot for the K3FeCN6 system with a slope of 59.6 mV and a calculated electron transfer number n = 0.99, corresponding to a single-electron electrode reaction. From its intercept, the measured potential EO’ = 0.275 V vs. SCE (standard calomel electrode) has a standard deviation of 0.001 for four measurements, which is basically in line with the value reported in the literature. The important thing in this experiment is that when the measurement is performed, the solution should be balanced with the electrode potential and all light absorption changes should stop. Only a small residual current and a small current generated by the edge effect pass through the working electrode.
1mol/L K3FeCN6(0.1mol/L KNO3), thin layer cell 0.24mm,
applied potentials (a)0.4, (b)0.32, (c)0.30, (d)0.28, (e)0.26, (f)0.24,(g)0.22, (h) 0.00 V (vs. Ag/AgCl)
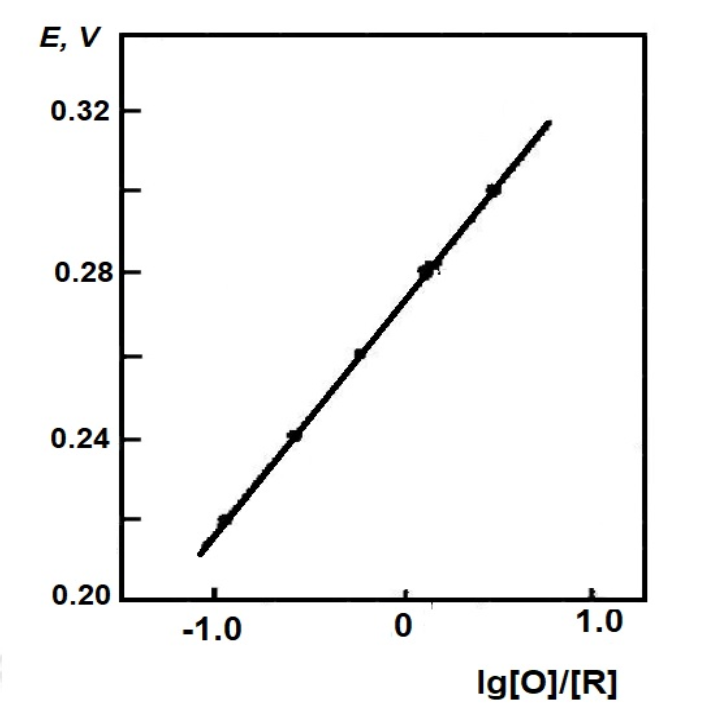
Fig. 4-2 Nernst diagram of the system for the K3FeCN6 system.
2. Quasi-reversible reaction
A typical example of this type of system is the vitamin B12 mentioned in Chapter 1, where the rate of electron transfer in the first electron reduction step is rather slow, even though the reduction wave is barely observed below the slow sweep used in the DC polar spectrum until the potential is sufficiently negative to produce a two-electron reduction wave. Fig. 4 3 shows the cyclic voltammogram for its negative potential sweep. At 0.93V vs. SCE potential, a two-electron reduction peak is shown. In contrast, the thin-layer spectroscopy constant potential experiment shows two consecutive, easily distinguishable one electron reduction steps.
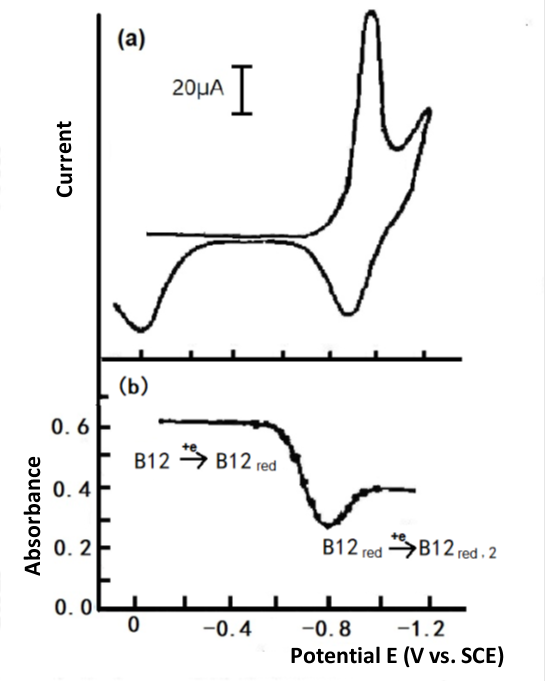
Fig. 4-3 Cyclic voltammetry of 1mmol/L Vitamin B12, Britton-Robinson buffer solution (pH 6.86), Hg-Au grid optically transparent electrode.
(a) Thin layer cyclic voltammetry
(b) Plotting the absorbance at 388 nm versus potential[3].
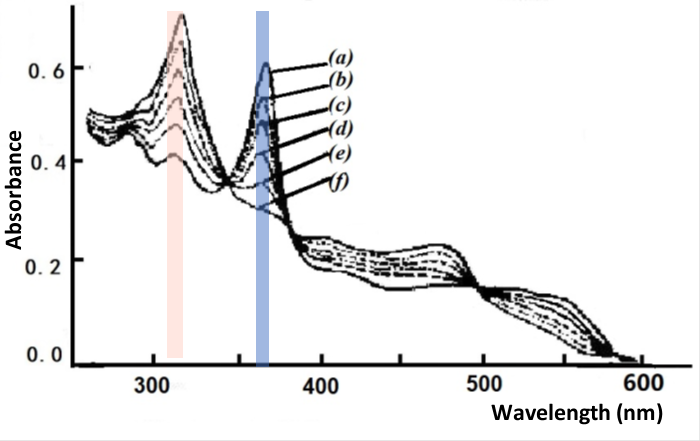
Fig. 4-4 Thin layer spectrum of B12 reduced to B12red.
Applied potential: (a) -0.550, (b) -0.630, (c) -0.660, (d) -0.690,
(e) -0.720, (f) -0.770 V vs. SCE [3].
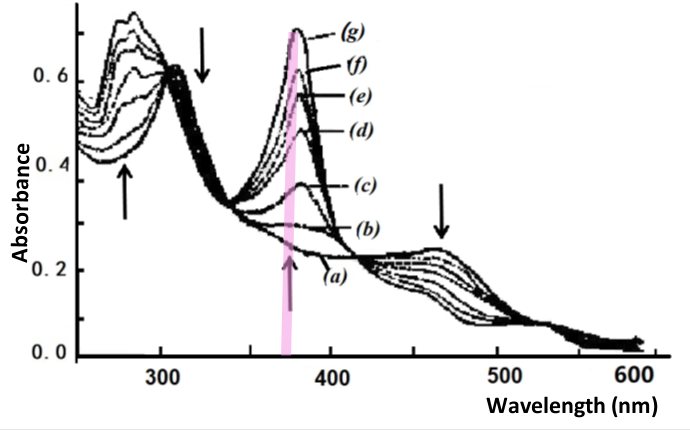
Fig. 4-5 Thin layer spectrum of B12red reduced to B12red.
Applied potential: (a) -0.770, (b) -0.820, (c) -0.860, (d) -0.880,
(e) -0.900, (f) -0.920, (g) -1.000 V vs. SCE [3].
Using a mercury gold mesh grid optical transparent thin layer spectroelectrochemical cell with a progressive potential applied from -0.10 to -1.15 V, two clear changes were observed in the UV-Vis spectrum of the B12 solution, one change occurring in the potential range of -0.58 to -0.75 V, as shown in Fig. 4-4. The starting spectrum at -0.55 V is derived from the initial B12, characteristic of Co(III), with an absorption band at wavelengths from 350 to 360 nm; a gradual step towards negative potentials most produces the absorption spectrum of B12 at -0.77 V, for example Co(II), and Nernst plotting using absorbance data at 360 and 311 nm indicates that the spectral change corresponds to a one electron reduction process with E1/2 = -0.655 V.
The second spectral change occurs in the potential range of minus 0.77 to -0.95 V. For example, as shown in Fig. 4-5, the starting spectrum at -0.770 V is that of B12, example Co(II), which gradually steps towards the negative potential to produce a spectrum of B12, monovalent cobalt, at -1.000 V. The absorbance data at 368 nm were plotted by Nernst to show that this change in absorbance also corresponds to a one electron reduction process with the formula potential E1/2 = -0.880 V.
3. Biological redox system using mediators
Many biological substances such as hemoglobin and myoglobin have a very slow direct heterogeneous electron transfer rate at the electrode. This behavior is usually due to their strong adsorption on the electrode surface and the fact that the electroactive centre is surrounded by their polypeptide chains, and these biological substances are difficult to study using the usual electrochemical methods. For such systems, the usual method is to add a mediator to the solution to regulate the electron transfer between the electrode and the biological component, based on the principle that:
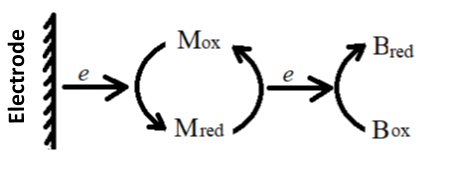
(4-12)
E = EO’B + (RT/nBF) ln{[OB]/[RB]
(4-14)
In the formula, M and B represent mediators and biomolecules, respectively. According to the applied potential and the ln{[OB]/[RB]} obtained by light absorption, make a Nernst diagram similar to the equation (4-10) to obtain EO’B and nBvalue.
For some biological systems, it is very important to measure EO’ to control the solution potential through the redox of the mediator and biological components. For example, in the absence of a medium, it takes several hours to electrolyze cytochrome C in an optically transparent thin layer cell, but only a few minutes with a suitable medium.
The basic requirements for selecting a mediator are: The mediator must quickly and reversibly exchange heterogeneous electrons with the electrode and transfer homogeneous electrons with biomolecules. Stable in both the oxidised and reduced states. Its spectrum does not overlap with the spectrum of biological components.
The thin-layer spectroelectrochemical method can also be used to easily determine the thermodynamic function of the system. The thermodynamic parameters ΔS0 and ΔH0 can be obtained from the variation of the equation potential EO’ with temperature by measuring the E - lg([O]/[R]) relationship curve for the same system at different temperatures.
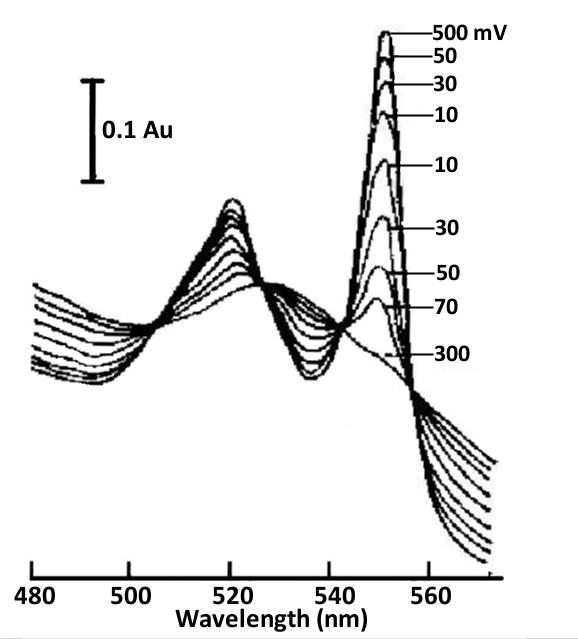
Fig. 4-6 Thin layer spectra of cytochrome C and 2,6-dichloroindophenol (DICP) mediators under different applied potentials, 0.5 mol/L phosphate buffer (pH 7.0) [4].
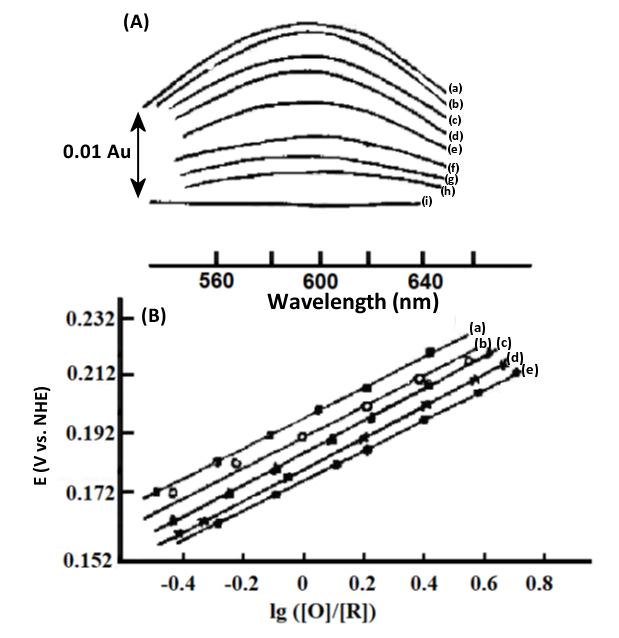
Fig. 4-7 (A) Thin-layer spectra of stellate anthocyanins at different applied potentials.
2.7×10⁻⁸ mol/L stellate anthocyanin and 2.8×10⁻⁸mol/L Ru(NH3)Py3+, thickness 0.021 cm, applied potential∶ (a) 240; (b) 230; (c) 220; (d) 210; (e) 190; (f) 175; (9) 150; (h) 145; (i) 90 mV vs. NHE.
(B) Nernst diagram at different temperatures[5].
ΔH0 = -nFEO' + ΔS0
Nernst diagram at different temperatures.
EO’ = 184 (±1 mV) vs. NHE (25℃)
ΔH0 = -71 (±4) kJ/mol
ΔS0 = -44 (±3) e.u.
(4-16)
Click to watch this lecture
Reference
[1] Song Shihua, Cheng Guangjin, Dong Shaojun, Analytical Chemistry, 15, 461 (1987).
[2] T. M. Kenyhercz, T. P. DeAngelis, B. J. Norris, W. R. Heineman, and H. B. Mark P, J. Am. Chem. Soc., 1976, 98, 9, 2469–2477
[3] Kenneth A. Rubinson, Eiki. Itabashi, and Harry B. Mark, Inorg. Chem., 1982, 21, 9, 3571-3573 .
[4] W.R.Heineman,B.J.Norris and J. F. Gaelz, Anal. Chem., 1975, 47, 1, 79–84.
[5] N. Sailasuta,F. C. Anson and H. B. Gray,J. Am. Chem. Soc., 1979, 101 (2), 455-458.

