Chapter V - Optically transparent thin layer spectroelectrochemistry (Part 2)
Non-ideal behavior of the Nernst plots
Ideally, the Nernst plot of E against lg{r(E)} should be a straight line, and this is the case for many systems, but in some cases deviations from a straight line have been observed, one of which is due to the overlap of the spectra of two or more redox substances in the solution being analyzed and the change of each spectrum within the potential range under study The second is the synergistic or interrelated nature of the different redox centers, which will be discussed separately below.
1. Spectrally overlapping, chemically uncorrelated redox systems
Considering the simultaneous existence of several uncorrelated redox systems in the solution, the Nernst equation for the half reaction of component i can be expressed as:
Fig. 5-1 shows lg{r'(E)} plotted against E for a two component system with different redox stoichiometry and spectral behavior. For comparison, the range of potentials added and the two-form redox potentials are concentrated around 0 mV, and the effects of having different formula redox potentials (E1o', E2o') are shown in Figure 5-1(A). As expected, when θ1 = θ2 ie the two components have the same stoichiometric potential and electron transfer number, the resulting Nernst plot (curve a) is a straight line with a slope of 2.303RT/AF.
However, when θ1 is not equal to θ2, it deviates from linearity. The greater the difference between the two equations, the more obvious the deviation. Therefore, according to the usual Nernst plot, fitting these data (θ1 = θ2) as linear will produce measurement errors in E1o' and x, as per the usual Nernst plotting, where the intercepts of the extensions of the two straight line section s on the y-axis give the equation volume potentials of the two electrochemical redox pairs, respectively, with the slope of each straight line region represents the number of electron transfers per electrochemical redox pair.
Fig. 5-1(B) shows the influence of different electron transfer numbers on the simulated Nernst diagram < n1 = 1, n2 = 2), even though it has the same formula and potential difference ΔEo' as the above Fig. 5-1(A) And ΔAi value, but the shape of the curve is quite different. Fitting these simulated responses according to the conventional Nernst plot will produce greater deviations in the measured values. The slope and intercept of the two linear parts in the figure can be used to obtain the respective equation potential and the number of electron transfers.

Fig. 5-1 (A) The influence of different absorbance change ratios on the simulated Nernst plots.
The parameters used in the simulation are: E1o' = 0 mV,E2o' = 0 mV(curve a); E1o' = -25 mV,E2o' = 25 mV (curve b);E1o' = -50 mV,E2o' = 50 mV (curve c); E1o' = -75 mV, E2o' = 75 mV (curve d); n1 = 1, n2 = 1; ΔA1 = 1, ΔA2 = 1
(B) The influence of different electron transfer numbers on the simulated Nernst plots.
The parameters used in the simulation are E1o' = 0 mV, E2o' = 0 mV (curve a); E1o' = -25 mV, E2o' = 25 mV (curve b); E1o' = -50 mV, E2o' = 50 mV (curve c); E1o' = -75 mV, E2o' = 75 mV (curve d); n1 = 1, n2 = 2, ΔA1 = 1, ΔA2 = 1 [5-1]

Fig. 5-1 (A) The influence of different absorbance change ratios on the simulated Nernst plots.
The parameters used in the simulation are E1o' = -75 mV,E2o' = 75 mV;n1=1,n2 = 1;ΔA2/ΔA1: 100(a),10(b),1(c),1/10(d),1/100(e)
(B) The influence of different absorbance change ratios on the simulated Nernst plots.
The parameters used in the simulation are E1o' = -75 mV, E2o' = 78 mV; n1 = 1, n2 = 2; ΔA2/ΔA1:100(a), 10(b),1(c),1/10(d),/100(e)[5-1]
In the redox potential, the voltage is fixed at 0mV, n1 = 1, n2 = 2, and the absorbance is changed, the simulated Nernst plots were very close to a straight line and the data yielded values between 1.0 and 2.0, depending mainly on the magnitude of the contribution of each redox pair to the total absorbance, with the equation amount potential very close to 0 mV.
Fig. 5-2(B) shows the two redox pairs with different electron transfer numbers respectively. In the limit, the slope and intercept of the Nernst diagram are approximately related only to the redox pair with the larger ΔA value, and the respective n and Eo' values can be obtained from the slope and intercept of each asymptote, respectively, when the light absorption of the two pairs does not vary much.
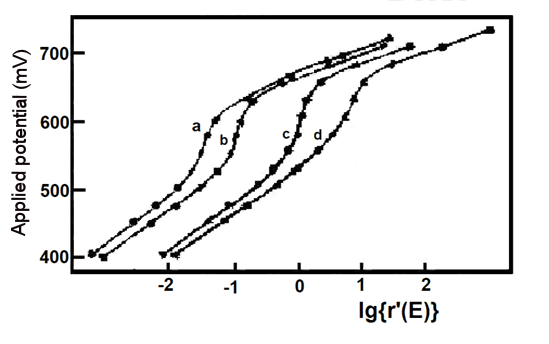
The thin-layer spectroelectrochemical experiments with mixtures of potassium ferricyanide and o-toluidine and their simulated responses are shown in Fig. 5-3 and Table 5-1. Potassium ferricyanide and o-toluidine were chosen because they can represent spectrally overlapping and well characterized spectroelectrochemical systems that are chemically uncorrelated, and in addition, these redox pairs provide convenient experimental pairs for assessing the validity of chemically uncorrelated redox system models.

Fig. 5-3 Experimental (**) and simulated (--) Nernst plots for mixtures of potassium ferricyanide and o-toluidine [5-1]

As shown in Figure 5-3, the agreement of the model with the experimental results is evident and the results of the mixture studies for Eo' and n values are also in agreement with the measurements when they are present separately. The average potential and electron transfer number of 663.6 ± 2.3 mV vs. Ag/AgCl for o-toluidine (experiments a, b, c, d) are consistent with the reported values of 659 mV and 1.9, and the results for potassium ferricyanide are also consistent. Finally, if the experimental data in the presence of a single component are analyzed in the two component simultaneous mode described above, the values of Eo' and n for the redox pairs that account for the major component (Table 5-1, Experiments 1', 2') are consistent with the results of the usual Nernst analysis (Table 5-1, Experiments 1, 2), but E2o' and n2 E2o' and n2 in Experiment 1' and E1o' and n1 are nonsignificant. Thus, the five variables (E1o', n1, E2O', n2, ΔA2/ΔA1) can be obtained from the experimental data measured for the mixture.
Reference
[5-1] E. W. Kristonson, D. H. Igo, R. C. Eider and W. R. Heineman, J. Electroanal. Chem.,309,61-72(1991).

