Chapter VI - Optically transparent thin layer spectroelectrochemistry (Part 3)
Non-ideal behavior of the Nernst plots
This article continues with the second part of the non-ideal behavior of Nernst plots.
2. Chemically correlated redox couple
- First discuss the competition between two ligands for a given redox pair.
For many redox pairs, the oxidation or reduction involves the substitution of a ligand and, therefore, its reduction potential (EO') is related to the properties of the ligand. To describe this situation, consider the competition between two ligands for the oxidized form of a given redox pair, where the two reactions have the same electron transfer stoichiometry, in which case the half reaction is∶
O-L1 + ne = R + L1 (6-1) O-L2 + ne = R + L2 (6-2)
The Nernst equation for the above reaction is
E = E1O' + (RT/nF)ln{CO-L1/(CRCL1)} (6-3) Rewrite the above two equations asE = E2O' + (RT/nF)ln{CO-L2/(CRCL2)} (6-4) CO-L1 = CRCL1θ1(E) (6-5) In the equation, CL1 and CL2 represent the concentration of free ligands, the equilibrium reaction between the two oxidation states after rearrangement must exist by subtracting equations (6-1) and (6-2).CO-L2 = CRCL2θ1(E) (6-6) The equilibrium constant K for the reaction of Eq. (6-7) can be expressed asO-L1 + L2 = O-L2 + L1 (6-7) K = CO-L2CL1/(CO-L1CL2)
= θ2(E)/θ1(E)
(6-8)Under most experimental conditions, CL1 and CL2 are very excessive and can be treated as constants. According to Beer's law, the total absorbance at any potential isK = exp{n(E1O' - E2O')F/RT} (6-9) Substitute equations (6-3), (6-6), and (6-8) into equation (6-10)A(E) = (εO1CO-L1 + εO2CO-L2 + εRCR + εL1CL1 + εL2CL2)d (6-10) A(E) = (α1CRθ1(E) + εRCR + εL1CL1 + εL2CL2)d (6-11) The total concentration of redox state substances is constantwhich α1 = εO1CO-L1 + εO2KCL2 (6-12) C* = CO-L1 + CO-L2 + CR
= {α2θ1(E) + 1} CR(6-13)
(6-14)Substituting equation (6-13) into equation (6-11), we getα2 = L1 + KCL2 (6-15) The limiting absorbance of the oxidized and reduced states can be expressed asA(E) = (α1θ1(E) + CO}C*d/{(α2θ1(E) + 1} + (εL1CL1 + εL2CL2)d (6-16) AO = (α1/α2)C*d + (εL1CL1 + εL2CL2)d (6-17) AO = εRC*d + (εL1CL1 + εL2CL2)d (6-18) In the case where CL1 and CL2 are significantly over C*, the Nernst plot is still linear, but it should be noted that the resulting interception is not the value of the potential E1O', because of the extra term on the right side of the equation ( 6-30).ln{r(E)} = ln(α2θ1(E)
= n(E - E1O')F/RT + ln{CL1 + KCL2}(6-19)
(6-20)
- Consider the following reversible processo, considering again the electrode process containing two consecutive electron transfers [6-1]
When equilibrium is reached at potential E
O ⇌ P ⇌ R (6-21) CO/CP = exp{(E - E1O')F/RT} (6-22) E1O' and E2O' represent the potential equation of O ⇌ P and P ⇌ R, respectively, since the total concentration remains constantCP/CR = exp{(E - E2O')F/RT} (6-23) The absorbance A(E) for a given wavelength isC* = CO + CP + CR (6-24) A(E) = d(COεO + CPεP + CRεR)
= AO+ d{CP(εP - εO) + CR(εR - εO)}
= AR + d{CO(εO - εR) + CP(εR - εO)}(6-25)
(6-26)
(6-27)which AO = dC*εO
AR = dC*εR(6-28)
(6-29)r(E) = {CO(εO - εR) + CPεP - εR)}/{CP(εO - εP) + CR(εO - εR)} (6-30) Substituting the equations (6-22), (6-23) into equation (6-31) and simplify to obtainr(E) = CP/CR{CO/CP(εO - εR) + εP - εR}/{CP/CR(εO - εP) + εO - εR} (6-31) For convenience, the following dimensionless variables are usedr(x) = (x/θ1δ)[x + (1-δ)θ1]/[x+(θ2/δ)] (6-32) Take the logarithm of both sides of equation (6-32)x = exp(FE/RT)
θ1 = exp(FE1O’/RT)
θ2 = exp(FE2O'/RT)
δ = (εO - εP) + (εO -εR)(6-33)
(6-34)
(6-35)
(6-36)Fig. 6-1 shows several representative Nernst plots using different values of θ1/θ2 and δ. For δ(1-δ) > θ2/θ1, the slope of the curve decreases from 1 at smaller x, passes through a very small value, and then increases to 1 at larger x values, as shown in curves (b) and (c). When δ(1-δ) < θ2/θ1, the slope increases from 1 through an extreme value and then decreases to 1, as shown in curve (e); curve (d) represents the special case of δ(1-δ)=θ2/θ1, where the slope remains constant with a value of 1. For the case where the absorption coefficient of the intermediate P is equal to that of O, δ= 0the slope of the Nernst diagram is connected from 1 with the smaller value of x. Increase to 2 when the value of z is larger, such as curve (a); for the case where the absorption coefficient of P is equal to that of R, that is, δ=1, the slope decreases continuously from 2 to 1, which is represented by curve (f).y(z) = ln{r(x)}
= lnx + ln{x + (1 - δ)θ1} - ln(x + θ(sub(2);/δ) - ln(θ1δ)(6-37)
(6-38)
![Fig. 6-1 Nerst plots for different values of [θ2/θ1, δ] Fig. 6-1 Nerst plots for different values of [θ2/θ1, δ]](https://www.als-japan.com/xdata/technical/Fig.6-1.png)
Fig. 6-1 Nernst plots for different values of (θ2/θ1, δ).
(a) 40, 0; (b) 40, 0.3; (c) 20, 0.5; (d) 4, 0.5; (e) 2, 0.9; (f) 2,1[6-1]
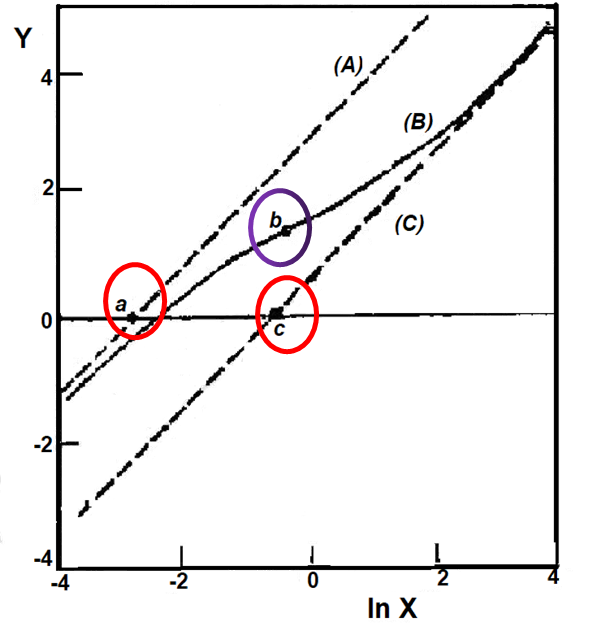
Fig. 6-2 shows the Nernst diagrams of the asymptote, the loading moment and the inflection point.
Curve (B) is Eq. (6-39) and θ1 = 1, lnθ2 = -3,δ = 0.2, asymptote (A) is Eq. (6-40) and (C) is Eq. (6-41) [6-1]
The slope of the above Nernst plot isdy/dlnx = 1 - x/[x + (1 - δ)θ1] + x/[x + θ2/δ] (6-39)
Thus, for 0 < δ < 1 , the slope converges to 1 as x tends to 0 and tends to ∞, as x → 0, the Nernst plot converges to an asymptote with slope 1.When x → ∞, the asymptote isyo(x) = lnx - ln{θ2/(1 - δ)} (6-40) The intersection of the two asymptotes on the horizontal line ln{r(E)} = 0 is given by x = θ2/(1 - δ) and x=θ1δ1, respectively, as shown at points a and c in Fig. 6-2.y∞(x) = lnx - ln(θ1δ) (6-41)
According to the differential equation (6-39), the value of inflection point b in the Nernst diagram is ½ln{θ1θ2(1 - δ)/δ}, ln{(1 - δ)/δ}. The slope of the value of (1 - δ)/δ at a point of the r(x) curve extremum, that is, the minimum slope when θ1θ2(1 - δ)/δ is greater than 1, and the maximum slope of θ1θ2(1 - δ)/δ. Therefore, the value of r(E) experimentally determined at the inflection point, plus the values of the two intercepts of the experimental asymptotic line (a, c) Based on this, we can estimate the values of θ1, lnθ2 and δ.

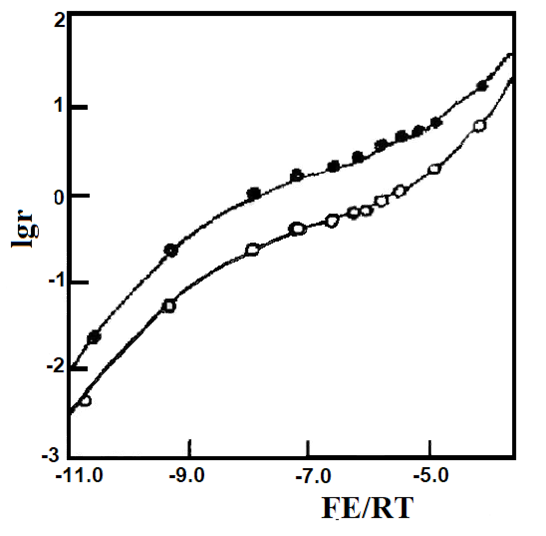
Figure 6-3 Nernst plotting of 1 mmol/L Au(squarate)2- in DMF [6-1].
Measured values at (•) 362 nm and (∘) 364 nm, using a gold raster optically transparent thin layer cell [6-2].
The theoretical curves were obtained based on E1O' = -0.104 V, E2O' = -0.249 V and δ = 0.44 (upper curve) and δ = 0.62 (lower curve).
Fig. 6-3 shows the Nernst plots of 1 mM gold squarate anion [Au(squarate)2]- in 0.5 M TEAP/DMF solution at two different monitored wavelengths (362 nm and 364 nm) through the experimental points the curves were calculated by Eq. (6-38) with E1O' = -0.104 V, E2O' = -0.249 V and the values of δ at different wavelengths, EO' and δ. The exact values were estimated by the above graphing method and then obtained by least squares regression.
Movie series on Basic knowledge of the spectroelectrochemical method - Optically transparent thin layer spectroelectrochemistry (Part 3)
Click to watch this lecture
Click to watch this lecture
Reference
[6-1] W.T.Yap, G.Marbung, E.A.Blubaugh and R.A.Durst, J. Elecroanal.Chem.and Interfacial Electrochem, 271, 325-329 (1989)
[6-2] E.A. Blubaugh and L.M. Doane, Anal. Chem., 54, 329-331 (1982)

