Chapter VI - Optically transparent thin layer spectroelectrochemistry (Part 4)
Non-ideal behavior of the Nernst plots
This article continues with the non-ideal behavior of Nernst plots for non-overlapping spectra and the electrode process for product deposition.
3. Non-overlapping spectra
The above discussed cases are all cases where the spectra of electroactive substances overlap, and the following case will be discussed when only one substance has light absorption [7-1].
a) For backward reaction (EC mechanism)
B ⇔ C
(7-2)
= EOA/B' + (RT/nF) ln(1 + K) + (RT/nF) ln[CA/(C* - CA)]
(7-7)
b) For forward reaction (CE mechanism)
For these systems mentioned above, which affect only the equilibrium concentrations of reactants and products, but not other electrochemical reactions, it is still possible to obtain n from the slope of the Nernst plot, but its intercept does not correspond to its equation potential.
c) Electrode process with two consecutive electron transfers (EE mechanism)
For the electrode process containing two consecutive electron transfers, already discussed in the previous paper.
CP/CR = exp[(E - E2O')F/RT]
(6-23)
d) For ECE mechanism
The Nernst plots are generally nonlinear for such systems where there are other electrochemical processes that affect the equilibrium concentration of the monitored substances.
4. Electrode process of product deposition
Consider the thin layer cell containing only the oxidizing substance O at the beginning, the concentration is CO*, and the initial absorbance of the solution is
When the potential steps to a more negative potential than ES, the concentration of O adjacent to the electrode surface will continue to decrease, and some of the reduced material R will be deposited on the electrode surface, because the concentration of R on the adjacent electrode surface cannot exceed SR, and at equilibrium, its concentration can be expressed by the Nernst equation as (7-21).
= [εOθ(E) + εR]CO*d/[1 + θ(E)]
(7-23)
At the potential of E = ES, CR = SRwe can get
ES = EO* + (RT/nF) ln[(CO* - SR)/SR]
(7-25)
εOθ(E)/[-εOθ(E) + εO]/f - εR)
(when E < ES)
(7-29)
f = SR/C
(7-31)
x = εR/εO
(7-33)
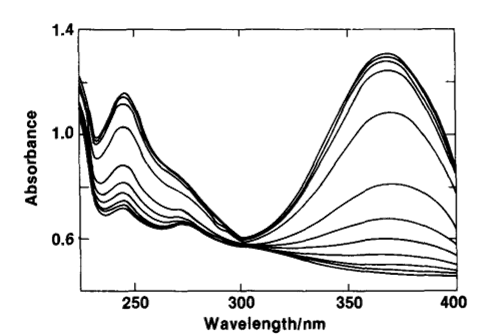
It was found that the laser dye 1-methyl-4(5-phenyl-2-oxazolyl)pyridinium p-toluenesulfonate was strongly deposited on the Au electrode after reduction.

Fig. 7-1 The relationship between the spectrum of the laser dye solution and the applied potential. 1-methyl-4-(5-phenyl-2-oxazolyl) pyridinium p-toluenesulfonate.
Applied potential (from top to bottom): -0.367, -0.900, -0.930, -0.955, -0.975, -0.990, -1.000, -1.010, -1.025, -1.045, -1.070, -1.100, vs. SCE (NaCl ).

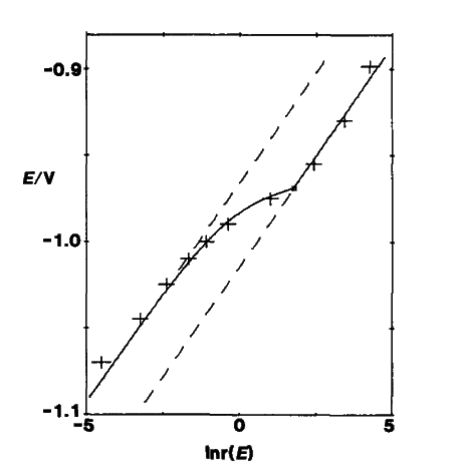
Fig. 7-2 The relationship between E and ln[r(E)].The experimental point measured at a wavelength of 368 nm is indicated by +.The solid line is the theoretical curve of formula (7-33) and formula (7-36), E0 = -1.014 V, SR = 0.35 mmol/L, C*= 2.36 mmol/L. The dashed line is the asymptote of equation (7-34) and equation (7-37).
Fig. 7-1 shows the absorption spectra of 2.36 mmol/L of the dye in 0.4 mol/L KCl aqueous solution at different applied potentials, with an absorption maximum at 368 nm for the oxidized state, which also shows that εR = 0. That is, there is no absorption in the reduced state, but only in the oxidized state.
Fig. 7-2 shows E as a function of ln[r(E)]. The experimental points measured at a wavelength of 368 nm are indicated by +. The solid lines are the theoretical curves of Eqs. (7-33) and (7- 36). The potential pair ln[r(E)] was plotted using the absorbance value at 368 nm, and the measured potential E0 = -1.014 V, SR = 0.35 mmol/L, C* = 2.36 mmol/L [7-2]. The dashed line is the asymptote of Eqs. (7-34) and (7-37).
Click to watch this lecture
Reference
[7-1] S. Dong and Y. Xie, J. Electroanal. Chem. 335, 197(1992)
[7-2] W. T. Yap, E. A. Blubaugh, R. A. Durst and R. T. Burke, J. Electroanal. Chem. and Interfacial Electrochemistry, 160, 73(1984)

