Section 1: Chronocoulometry (electrochemical measurement technique)
1-1 Summary
In electrochemical measurement, the technique of measuring the current response to time caused by the application of a potential step is called chronoamperometry.
Furthermore, the technique of measuring the amount of charge integrated over this amount of current is called chronocoulometry.
The reason why the shape of the chronocoulogram (charge-time curve) is the way it is can be understood by considering the concentration gradient in the solution near the electrode.
Chronocoulometry is:
- Electrode surface area
- Diffusion coefficient
- Time window of an electrochemical cell (time range that can be effectively used for accurate measurements)
- Electrochemical adsorption of active species
It is useful for measuring such as, and estimating the rate constant and reaction mechanism of the preceding or following chemical reaction.
1-2 Introduction
Chronocoulometry is one of the standard electrochemical measurements frequently used in the field of electroanalytical chemistry.
As the name suggests, chronocoulometry measures the amount of electric charge (coulomb) against time (chrono).
- Electrode surface area
- Diffusion coefficient
- Measurement of concentration
- Discussion of kinetics and reaction mechanism of continuous chemical reaction
- Electrode charge transfer rate
- Adsorption
- Measurement of the effective time width of an electrochemical cell
It can be performed by this fundamental and versatile method.
1-3 Applied voltage waveform
Chronocoulometry, one of the electrochemical measurement methods, changes the electric potential applied to the cell in steps.
The potential waveform is shown in Fig. 1-1A. The initial potential is changed stepwise from Ei to Es.
- Ei is the potential at which electrolysis does not occur, and Es is the potential at which oxidation or reduction occurs.
- The experiment ending with Es is called single potential step chronocoulometry, while in double potential step chronocoulometry the potential is changed to a third value, Ef.
- Ei and Ef are often chosen to have the same value. The change from Ei to Es is called the forward potential step, and the change from Es to Ef is called the reverse step.
- Just as Es is chosen to be the potential at which electrolysis occurs, Ef is chosen to be the potential at which electrolysis of the product occurs during Es.
- To understand chronocoulometry, it is helpful to consider how the concentration distribution at the electrode interface looks when a stepped potential is applied. The Nernst equation expresses the relationship between the electrode potential and the concentration of the reversible redox system on the electrode surface.
The following equation (1) is the Nernst equation for a redox system and is given by equation (2) (25 °C).

Eq. (2)
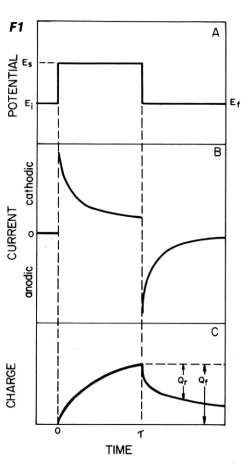
Fig. 1-1 Chronocoulogram.
where: E is the electrode potential, E0R‚O is the standard redox potential, n is the number of electrons, C0O and C0R are the surface concentrations of oxidized and reduced substances, respectively.
From equation (2), it can seen that the surface concentration ratio C0R/C0O changes as the electrode potential changes. The change is accompanied by the reduction of the oxidant or the oxidation of the reductant at the electrode surface, resulting in the flow of electrons, or current, in the circuit.
Table 1-1 shows how the C0R/C0O changes as the potential changes from the standard potential, and it can be seen that the surface concentration ratio changes significantly for potential changes below 500 mV.
| CSR/CSO | E (mV) | |
| n = 1 | n = 2 | |
| 1/10,000 | 236 | 118 |
| 1/1000 | 177 | 88.5 |
| 1/100 | 118 | 59 |
| 1/10 | 59 | 29.5 |
| 1 | 0 | 0 |
| 10/1 | -59 | -29.5 |
| 100/1 | -118 | -59 |
| 1000/1 | -177 | -88.5 |
| 10,000/1 | -236 | -118 |
1-4 Concentration-distance (C-d) profile
In chronocoulometry, one of the electrochemical measurement techniques, the variation of surface concentration associated with a potential step creates a concentration gradient near the electrode. The gradient is represented as a concentration-distance profile as shown in Fig. 1-2. For example, consider a solution containing 1 mM of oxidant (O) and a supporting electrolyte, where Ei is chosen positive enough for E0R‚O that the reduction of O does not occur. The concentration of O in Fig. 1-2A is constant from the surface to the offshore of the solution, while the concentration of R in Fig. 1-2B is constant (low enough to be considered zero in the figure). ES is chosen to be negative enough for E0R‚O that all O on the surface is reduced to R.
As a result of the potential step ES, the concentration gradient is shown in Fig. 1-2a, b. The concentration gradient drives the diffusion of the oxide from offshore to the surface. The concentration gradient is the driving force for the diffusion of the oxide from the offshore to the surface, and the diffuse layer extends offshore with time as shown in c and d. As O disappears, R accumulates near the electrode, and the time evolution of the concentration gradient of R is shown in b, c, and d in Fig. 1-2B.
R diffuses from the electrode to the offshore direction, contrary to O. In any case, it diffuses from the high concentration side to the low concentration side. It is important to note that in order to obtain the profile shown in Fig. 1-2, the mass transfer occurs only by diffusion, and the solution must be kept quiet so that convection does not occur.
What happens when we step to a sufficiently positive potential (for E0R‚O), Ef, where CSR becomes zero? Considering equation (2), we can see that the ratio CSR/CSO immediately becomes small.
Therefore, the R produced during the forward potential step is oxidized back to O during the reverse step. The concentration-distance profiles in Fig. 1-2C and D show that some of the R diffuses back to the electrode surface and is oxidized to O. The rest of the R diffuses into the solution, which means that not all of the O is recovered by the reoxidation of R.
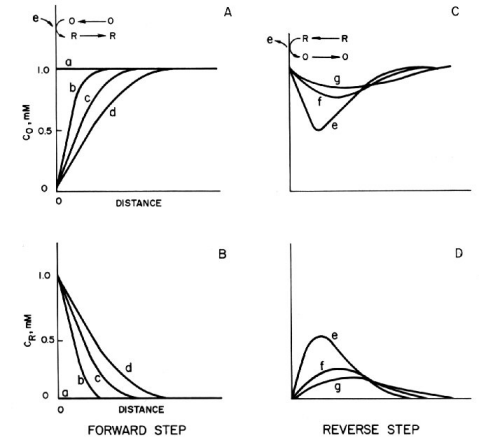
Fig. 1-2 Transition of concentration-distance profile caused by potential step.
A, B: Oxidized (O) and reduced (R) compounds in the forward step
C, D: Oxidized (O) and reduced (R) compounds during the reverse step
1-5 Current response
In chronocoulometry, one of the electrochemical measurement techniques, the potential step response is the current due to the electrolysis of O or R shown in equation (1). The current is proportional to the gradient of the C-d profile at the electrode surface for the reduction of O, as shown in equation (3) below.

Eq. (3)
where i is the current (A), n is the number of reacting electrons (eq/mol), F is Faraday’s constant (96,485 C/eq), A is the electrode area (cm2), CO is the concentration of O (mol/cm3), DO is the diffusion coefficient of O (cm2/s), and t is the time (s).
Using equation (3), we can predict the shape of the current-time response from the slope of the C-d profile at x = 0 (electrode surface) of the component being electrolyzed.
Chronoamperometry is a time-varying measurement of current. The chronoamperogram is the current-time response to a potential step. A chronoamperogram for a double potential step is shown in Fig. 1-1B.
When the potential is stepped from Ei to ES, a large cathode current immediately flows and slowly decays. Consider how this response corresponds to the slope of the C-d profile for O in Fig. 1-2A.
When the potential is returned to Ef, a large anode current immediately flows and slowly decays. This response also corresponds to the gradient of the C-d profile against R in Fig. 1-2D. The current is a measure of the rate at which a component is electrolyzed at the electrode surface. In the experiment described above, electrolysis is governed by the rate at which O or R (at the forward or reverse step, respectively) arrives at the electrode surface, that is mass transfer by diffusion. The decay of the i-t curve after the potential step reflects the fact that the arrival rate of O (or R ) also decreases as the concentration in the vicinity of the electrode decreases. In other words, O (or R) has to travel a longer distance over time to reach the electrode as the experiment progresses. The following Cottrell equation represents the current-time curve for chronoamperometry. Note that the current decreases as a function of t-1/2.

Eq. (4)
1-6 Charge response
Chronocoulometry
One of the electrochemical measurement techniques, chrono-amperometry is basically chronoamperometry, but it is a measurement method that takes another step from chronoamperometry. It integrates the current over time to obtain the charge (Q) response over time. Therefore, chrono-amperometry gives the same potential perturbation as chronoamperometry. The resulting Q-t curve is given by the integral of equation (4) over the forward step (equation (5)).

Eq. (5)
Double potential step chronocoulometry
A typical result obtained by double potential step chronocoulometry is shown in Fig. 1-1C. It is just a mathematical integration of Fig. 1-1B.
As can be seen from equation (5), Q increases as a function of t1/2 during the forward step. The value of Q at a given point corresponds to the total amount of O reduced by that time (equal to the amount of R produced). Therefore, i is a measure of the electrolysis rate at a certain point in time, while Q is a measure of the amount of substance that has been electrolyzed by that time.
At time τ, the potential is stepped back in the original direction and the anodic reaction is started. The result is the charge (Qr) for the oxidation reaction of R subtracted from the final value of Q in the forward step (Qf in Fig. 1-2C, which is the baseline in the reverse step). The formula that applies to the reverse step is shown in equation (6) below.

Eq. (6)
1-7 Selection of Ei and Es by Cyclic Voltammetry
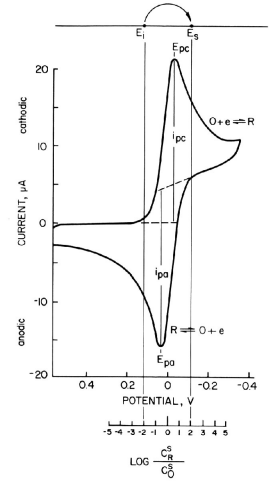
Fig. 1-3 Cyclic voltammogram of reversible system (EO = 0 V, n = 1)
The choice of Ei and Es is an important aspect of chronocoulometry experiments, which can be somewhat difficult in redox systems where E0R‚O are not specified. In this case, cyclic voltammetry measurements can be performed in advance to determine the potential range of the redox pair at the working electrode and the supporting electrolyte system used.
A typical cyclic voltammogram of a reversible system is shown in Fig. 1-3, where only O is in solution, E0R‚O are assumed to be zero volts, and a one-electron process is considered. As can be seen from Table 1, when stepping from Ei = +118 mV to Es = -118 mV, the surface concentration ratio C0R/C0O changes from 1/100 to 100/1.
This change is sufficient to make the surface concentration of O virtually zero, and equation (5) (section, 1-6 Charge response) holds. In order for the concentration ratio to change sufficiently so that the surface concentration of O is indeed “virtually zero”, a larger potential change should be applied if possible. For example, a change from +177 mV to -177 mV will give a change in concentration ratio from 1/1000 to 1000/1.
1-8 Evaluation of electrochemical cell
One of the useful applications of chronocoulometry, an electrochemical measurement technique, is to determine the time width over which planar diffusion (one-dimensional diffusion) occurs in the electrochemical cell used.
Equation (5) (section 1-6 Charge response) is calculated based on the assumption that the electrode is flat, that the potential change occurs instantaneously, and that the mass transfer of electrochemically active species to the electrode surface occurs only by diffusion, with no contribution from convection. As can be seen from equation (5), Q/t1/2 is constant.
When this value is plotted against time, it becomes as shown in Fig. 1-4, which is constant over a wide time range, and this time range represents the time frame in which the condition of planar diffusion is satisfied. The increasing trend after a long period of time is due to a small contribution from convection, probably as a result of oscillations. Such a small convection contribution is sufficient to take the measurement after about a minute, even in a cell protected from vibration.
Another reason for the increasing trend is the contribution of spherical diffusion caused by the suspended mercury dropping electrode. In such electrodes, flat diffusion can be considered only up to about one second, after which spherical diffusion is mixed. There is a decreasing trend in a short time. This is due to the fact that the potentiostat is not perfectly capable of changing the cell potential instantaneously.
The uncompensated solution resistance between the electrodes causes a time delay in the potential change of the cell. Therefore, the ratio C0R/C0O does not change instantaneously. As a result, the current value is slightly smaller than the theoretical value and the Q value is also smaller until the potential reaches the set value. The time required for a cell potential change is typically microseconds to milliseconds. This time can be shortened by minimizing the uncompensable solution resistance between electrodes. Bringing the reference electrode and the working electrode as close together as possible, increasing the supporting electrolyte concentration, and reducing the electrode area will help reduce the time delay in the cell response.
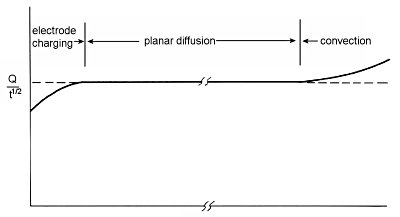
Fig. 1-4 Example of a plot of Q/t1/2.
1-9 Measurement of A, D, n, C
As can be seen from equation (5), A, D, n, and C can be calculated from Q/t1/2. Chronocoulometry is a standard method for determining the electrode surface area using a system with known D, n, and C, such as the ferrocyanide - ferricyanide system. If the surface area is determined in this way, the diffusion coefficient can be measured from chronocoulometry. In this case, n and C must be known. The values of n is usually obtained from thin-layer coulometry, peak-to-peak potential difference in cyclic voltammetry, E vs. logi/(id-i) plot in polarography, or the rotating electrode method. It can also be obtained from Q/t1/2 assuming a reasonable value of D.
While the potential step method is certainly an important part of the electrochemical analysis methods typically used for quantitative analysis (e.g., pulse voltammetry), chronocoulometry has relatively rarely been used to determine concentration C. One of the few cases where stripping voltammetry has been useful is when the stripping peak is a single peak. In particular, when multiple stripping peaks overlap rather than a single peak, setting the potential step to include all of them and integrating the current allows for a more accurate quantitative analysis.
1-10 Adsorption
Chronocoulometry is particularly suitable for studying electrochemically active species adsorbed on electrode surfaces. In fact, it was the study of adsorption that led to the development of this technique. The charge used to electrolyze the adsorbed species is distinguished from the charge used to electrolyze the components in the solution. That is, the adsorbed species is on the electrode and is instantly electrolyzed, while the solution species must diffuse to the electrode in order to be electrolyzed. As a result of the potential step, the total charge measured (Qtotal) consists of three contributions. That is,
(a) Charging of the electric double layer (Qdl)
(b) Electrolysis of adsorbed species (Qads)
(c) Electrolysis of solution species (Qdiff)
Where ΓO is the amount of O adsorbed (mol/cm3). The contribution of each component is shown in Fig. 1-5A, where Qdiff is expressed by Eq. 5 and the plot against t1/2 is a straight line.

The gradient is 2nFACODO1/2π-1/2. The second term in equations (7) and (8) is the charge from the adsorbed species. Since the adsorbed species are on the electrode, they are immediately electrolyzed by the potential step. Therefore, this term is time-independent and constant, as shown in Qads in Fig. 1-5A Qdl is the charge required to transfer the cell potential from Ei to Es. This term also occurs essentially instantaneously, as represented by Qdl in Fig. 1-5A.
(However, it is assumed that the electrode time in Fig. 1-4 is short.)
Qtotal is given by the addition of Qdiff, Qads and Qdl, as shown by the curve Qtotal in Fig. 1-5. As can be seen from equation (8), the plot of Qtotal against t1/2 is a straight line with the intercept equal to nFAΓO + Qdl as shown in Fig. 1-5B. If Qdl is known, ΓO can be calculated from the intercept for a known electrode at A. Qdl for a potential step from Ei to Es can be measured from an experiment involving only the supporting electrolyte.
However, this method assumes that Qdl is the same with or without the presence of adsorbed species, which may not be the case. The double potential step method may provide a better correction for Qdl.
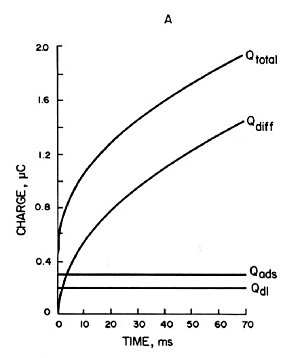
A) Charge-time curve of each component contributing to the total charge (Qtotal) in Equation (7).
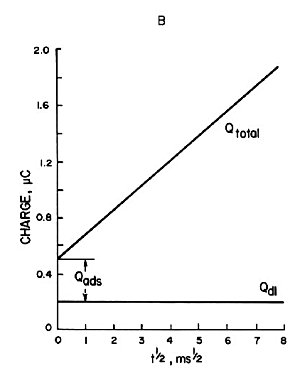
B) Plot of charge against (time)1/2.
Fig. 1-6 shows the double potential step chronocoulometric plots for the two cases. For the forward step it is plotted against t1/2, and for the reverse step it is plotted against Τ + (t - Τ)1/2 - t1/2.
Plots 1 and 2 are for the case where neither reactants nor products are adsorbed and the intercepts of both plots are equal, corresponding to Qdl. Plots 3 and 4 are for adsorbed reactants and no adsorbed products. The intercept of plot 4 for the reverse step corresponds to Qdl even though there is adsorbed reactant. The intercept of plot 3 contains both Qdl and Qads because there is adsorbed reactant, and the difference between the intercepts of plots 3 and 4 equals Qads.
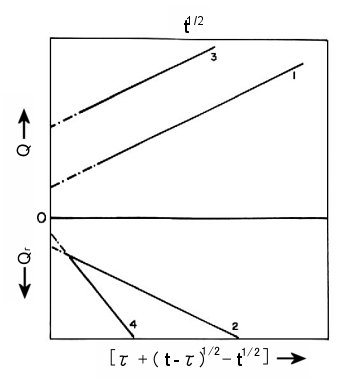
Fig. 1-6 Double potential step chronocoulometric plot in the presence of adsorption.
1,2; without adsorption of the reactive or productive species,
3,4; with adsorption of the reactive species and no adsorption of product species.
1-11 When chemical reactions are involved
Chronocoulometry, an electrochemical measurement technique, is suitable for the study of heterogeneous redox reactions that occur at electrodes (homogeneous chemical reactions accompanied by electrode charge transfer reactions, that is, preceding or following chemical reactions in solution). Such chemical reactions produce predictable and measurable changes in the Q-t response, providing information on the chemical reaction mechanism and kinetics. The study of subsequent chemical reactions, as shown in the following EC mechanism, is a good example of how chronocoulometry can be used.
R, formed by electrochemical reduction of O by a potential step from Ei to Es, is the reactive species and produces P with a reaction rate k. This mechanism is written as EC, where E comes from Electrode reaction and C from Chemical reaction. The homogeneous chemical reaction to produce P from R can be studied by double potential step chronocoulometry. Fig. 1-7 shows how the chronocoulogram of the EC mechanism changes depending on the reaction rate k. (k↑ is the direction in which the rate constant increases).
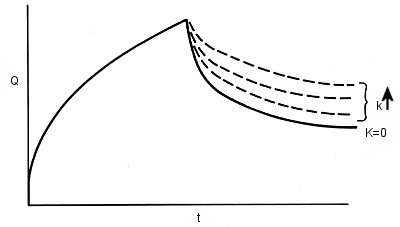
Fig. 1-7 Double potential step chronocoulogram with EC mechanism.
During the forward step, the chronocoulogram is not affected by subsequent chemical reactions. This is to be expected, as the mass transfer of O to the electrode surface depends on CO and DO, and not on what happens to the electrolytically generated R. (Of course, if R reacts and does not produce O, but it does, then another mechanism must be considered.)
The reverse step phase of the chronocoulogram is sensitive to the value of k. The value of k is obtained from the action curve consisting of dimensionless parameters calculated from the theory. The action curve for the EC mechanism is shown in Fig. 1-8.
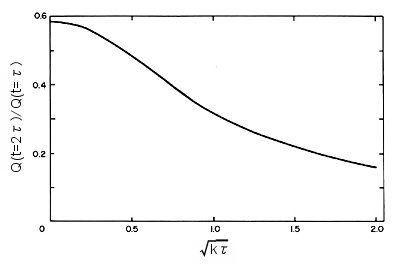
Fig. 1-8 Action curve when EC mechanism is valid.
The curve shows how the ratio Qr/Qf varies as a function of (kΤ)1/2. Measure Qr/Qf for a potential step of period Τ, read the corresponding value of (kΤ)1/2 from the action curve, and calculate k. The shape of the action curve depends on the mechanism of the subsequent chemical reaction. As the rate constant of the chemical reaction increases, Qr decreases. The faster the chemical reaction, the smaller the Qr because less R is reoxidized to O during the reverse step.
1-12 Conclusion
Chronocoulometry, one of the electrochemical measurement techniques, is very useful and applicable to a variety of chemical systems.
Some of these advances are listed in the literature below.
Reference:
1) P.T.Kissinger and W.R.Heineman, eds., "Laboratory Techniques in Electroanalytical Chemistry", Marcel Dekker, New York, (1984).
2) P.T.Kissinger, Current Separation, 6(4) (1985) 62.
3) P.T.Kissinger and W.R.Heineman, J. Chem. Ed., 60 (1983) 702.
4) R.E.Shoup, Current Separation, 4(2) (1982) 31.
5) J.Y.Lewis, T.C.Pinkerton, E.Deutsch and W.R.Heineman, Anal. Chim.Acta, 167 (1985) 335.
6) J.H.Christie, G. Lauer, R.A.Osteryoung, Anal. Chem.,35 (1963) 1979.
7) J.H.Christie, G.Lauer, R.A.Osteryoung, J. Electroanal. Chem.,7 (1964) 60.
8) F.C.Anson, Anal. Chem., 38 (1966) 54.
9) J.H.Christie, R.A.Osteryoung and F.C.Anson, J. Electroanal. Chem.,13 (1967) 236.
10) F.C.Anson, J.H.Christie and R.A.Osteryoung, ibid, 13 (1967) 343.
11) A.J.Bard and L.R.Faulkner, "Electrochemical Methods", Wiley, New York (1980), p.199-206.
12) F.C.Anson and R.A.Osteryoung, J. Chem. Ed., 60 (1983) 293.
13) J.H.Christie, J. Electroanal. Chem., 13 (1967) 79.

