High Sensitivity Electrochemical Detection Using Interdigitated Array Electrode (IDA)
- Part 1: Introduction
- Part 2: Manufacturing of IDA electrode
- Part 3: Features of IDA electrode
- Part 4: High-sensitivity voltammetry using IDA electrodes
- Part 5: Self-induced redox cycle
- Part 6: Conversion stripping method
- Part 7: Application: 7.1 Measurement of oxidized standard substances
- Part 7: Application: 7.2 Measurement of reduced standard samples
- Part 7: Application: 7.3 Analysis of micro volume sample
- Part 7: Application: 7.4 Highly sensitive and selective detection of dopamine
- Part 7: Application: 7.5 Application to liquid chromatography detector
- Part 8: Conclusion
- Reference
Part 1: Introduction
Electrochemical measurements are often used to detect trace substances or to observe the reaction behavior of substances.
In electrochemical measurements, when the electrode area is reduced to the micrometer scale, the diffusion of substances to the electrode changes from linear to spherical, resulting in an increase in the amount of substances reaching the electrode surface per unit time and unit area. As a result, the observed current density increases and exceeds the limits of conventional measurements, which is why microelectrodes are of interest [1-4].
Therefore, these features can be used for the study of biosensors [5], detection of reaction intermediates and analysis of reaction processes [6], electrochemical reactions in high-resistance solutions and solids [7], and organic electronic devices [8-10].
Electrochemical measurements using these microelectrodes have the following characteristics:
1) Due to the smaller size of the electrode and the smaller current value, the iR drop can be reduced. This makes it possible to measure samples with high resistance.
2) The charging current of the electric double layer is reduced, enabling fast measurement of high signal to noise (S/N) ratio.
3) Since the diffusion is isotropic and the current density is high, the steady state can be reached in a short time.
In recent years, the application of (Large scale integration) LSI fabrication technology has enabled the reliable and efficient fabrication of not only disk and wire shaped electrodes, but also microelectrodes with complex shapes.
Therefore, it was found that by designing the electrode shape and arrangement, functions such as current amplification and enhanced selectivity can be obtained.
Here (Part 2), we will take a tiny IDA electrode as an example and lift up the metal to get a IDA electrode pattern. The whole surface of the pattern is covered by an insulating film, and the photoresist pattern is formed again in the area that needs to be covered by the insulating film, such as the lead area, and the insulating film not covered by resist is dry-etched until the electrode area is exposed to obtain a IDA electrode.
On the other hand, even materials that are difficult to fabricate at low temperatures, such as carbon films with a wide potential window on the reducing side and ITO (transparent electrodes), can be easily processed into microelectrodes [11] if the entire substrate surface is first covered with a thin film of the electrode material and then processed by etching methods.
Part 2: Manufacturing of IDA electrode
Fig. 2-1 shows a schematic of the manufacturing process of IDA electrodes.
A 3-inch silicon wafer substrate with oxide film is used. First, photoresist layer is coated on the substrate, and covered with a masking film with a pattern, followed by UV light exposure, and then developed with an alkaline solution to form an interdigitated array electrode pattern (A). Next, the substrate is placed in a sputtering device, and a thin layer (B) of metallic chromium coating and metallic gold is deposited in sequence.
In addition, the photoresist layer is dissolved in an organic solvent, and the unwanted metal covered by the photoresist is peeled off (lift-off) to obtain an interdigitated array electrode pattern (C). The entire surface of the pattern is covered with an insulating film, and the photoresist pattern is formed again on the areas that needs to be covered by the insulating film, such as the lead part (D), and the insulating film that is not covered with resist is dry etched until the electrode area is exposed (E).
On the other hand, using a process in which the entire substrate surface is first covered with a thin film of electrode material and then processed by an etching method, materials that are difficult to fabricate at low temperatures, such as carbon thin film with a wide potential window on the reduction side and ITO (transparent electrode), can be easily processed into microelectrodes [11].
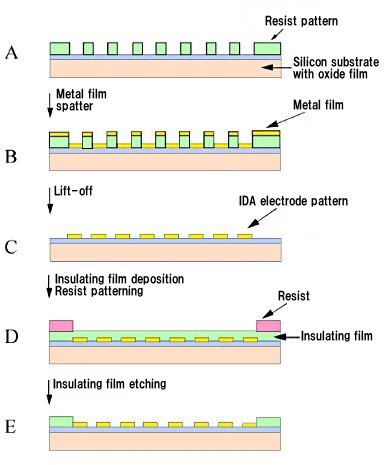
Fig. 2-1 Schematic of manufacturing process of micro interdigitated array electrodes.
(☆ Some interdigitated array electrodes sold may vary slightly due to improvements, etc.)
Part 3: Features of IDA electrode
In addition to being an aggregate of band electrodes, the IDA electrode exhibits interesting behavior not seen in other electrodes by arranging the two IDA electrodes combined and meshes with each other. That is, redox species oxidized at one electrode (G-pole: generator electrode) can be reduced at the other electrode (C-pole: collector electrode).
A similar experiment can be performed with a rotating ring-disk electrode, but with an IDA electrode, the current value is apparently increased due to "redox cycling" (Fig. 3-1), in which the reduced redox species diffuse back to the original electrode.
Furthermore, since a linear concentration gradient is immediately formed between the G and C poles, the time required to reach a steady state is shortened, resulting in a fast response. In addition, when the potential of the C-pole is kept constant and the potential of the G-pole is swept, the reverse reaction of the G-pole can be determined at the C-pole. Since the potential of the C-pole is constant, no charging current flows during measurement, and the signal-to-noise ratio is improved.
Furthermore, when a reversible substance and an irreversible interfering substance coexist, because the interfering substance oxidized at the G-pole is electrochemically inactive and cannot be detected at the C-pole, so that only the target substance can be selectively detected.

Fig. 3-1 Conceptual diagram of the redox cycle.
The steady-state critical current of the IDA electrode can be obtained analytically by solving the two-dimensional diffusion equation, which is expressed by the following equation[12]:
p = 4S/(1+S)2
S = sin(πwg/2w)/cos(π(wa - wc/4w)
w = (wa + wc)/2 + wg
(2)
(3)
(4)
Part 4: High-sensitivity voltammetry using IDA electrodes
Fig. 4-1 shows a cyclic voltammogram of ferrocene using a IDA electrode.
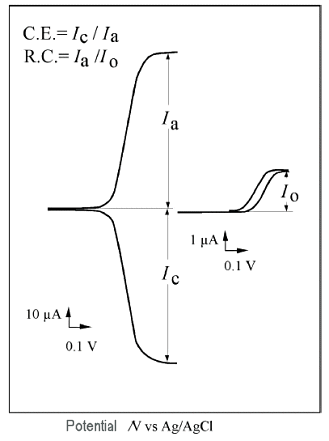
Fig. 4-1 Cyclic voltammetry of IDA electrode.
A shows the simultaneous recording of the currents at the two electrodes with the oxidation current as positive when one electrode (C electrode) is fixed at the reduction potential and the potential of the other electrode (G electrode) is scanned ( Fig. 3-1 Conceptual diagram of a redox cycle is a normal cyclic voltammogram when scanning without applying a potential to the C electrode (O mode).
In A, the oxidation current at the G-pole begins to increase around 0.4 V, and the reduction current at the C-pole increases accordingly, until they both become constant around 0.6 V and have the same absolute value. The ratio of the reduction current to the oxidation current is about the same.
This ratio of reduction current to oxidation current is called the capture rate, which indicates how much of the oxide generated at the G-pole reaches the C-pole.
In voltammetry using IDA electrode, a high capture ratio of more than 90% can be obtained. On the other hand, when no potential is applied to the C-pole, redox cycling does not occur and the response is based on the normal diffusion rate, resulting in a small current Io at the G-pole.
Therefore, the ratio of the current Io to the current Ia when potential is applied to the C electrode is defined as the redox cycling number, and is used as an index to compare the ratio of the apparent current increase.
Figure 4 plots the limiting currents for comb-shaped electrodes with different electrode widths and gaps according to equation (5).

Fig. 4-2 Shape dependence of limiting current of IDA electrode.
Furthermore, the capture rate and the number of redox cycling for redox species with different diffusion coefficients were examined, and it was found that both were independent of the redox species and were determined only by the electrode geometry.
Figure 5 shows the dependence of the redox cycling number on geometry for the four reversible reactive species. In particular, when the electrode is miniaturized, the redox cycling number increases rapidly, and the critical current increases with the increase in the number of cycles. This suggests that miniaturization is effective in increasing sensitivity.
Part 5: Self-induced redox cycle
The redox cycle is a phenomenon that occurs when two electrodes in close proximity are set to different potentials (one electrode at oxidation potential and the other at reduction potential), but by using a special electrode configuration, a redox cycle can be induced by controlling the potential of only one electrode.15
A special electrode configuration is when a large area conductor (macroelectrode) is placed near the microelectrode that controls the potential.
If the microelectrode is surrounded by an insulator, the reductant generated at the microelectrode simply diffuses spontaneously along the concentration gradient to eliminate the concentration difference (Fig. 3-2). However, if a macroelectrode is placed near the microelectrode, the generated reductant diffuses to the macroelectrode and is oxidized at the point facing the microelectrode on the macroelectrode, while a reduction reaction is induced at the point away from the microelectrode on the macroelectrode. At this time, the electrons generated by the oxidation reaction are consumed by the reduction reaction, resulting in electron transfer inside the macroelectrode, that is, current flows.
The reverse reaction occurs at both ends on the macroelectrode in order to eliminate the concentration gradient of the reductant produced at the microelectrode, but the process by electron transfer within the macroelectrode is faster and more dominant than the process by natural diffusion of the reductant. In addition, the oxidant species generated at the macroelectrode diffuses to the microelectrode, reduce again and initiate a redox cycle.
Due to this naturally induced redox cycle (self-induced redox cycle), the critical current is amplified by controlling only the potential of the microelectrode (Fig. 3-2). This self-induced redox cycle phenomenon was confirmed by comparing the critical current values obtained in electrodes provided with microcircular electrodes in an insulator and where the microcircular electrode is placed in a macroelectrode separated by a thin film.
The limiting current values obtained by controlling the potential of only the latter microelectrode were several times larger than those obtained with the former electrode and equal to those obtained when the latter macroelectrode was also potential controlled to artificially induce the redox cycle.
A more direct confirmation would be to measure the current flowing through the macroelectrode, which was possible by connecting one of the IDA electrode to another macroelectrode via an amperometer. The current value when the self-induced redox cycle was expressed was equal to the limiting current value when the IDA was measured in twin mode.
The self-induced redox cycle effect was also confirmed in dual cells, where IDA electrode and macroelectrode were housed in separate cells and the cells were connected by salt bridges (Fig. 5-1).
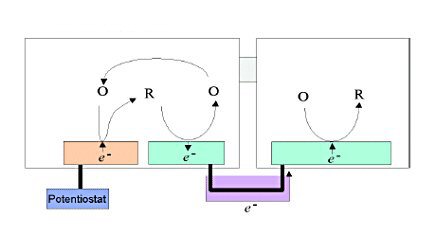
The dual cell has the characteristic that the self-induced redox cycle can be expressed by the reaction of different active species at the IDA and the macroelectrode.
Part 6: Conversion stripping method
A self-induced redox cycle can be generated even if the redox substance in the cell housing the macroelectrode is replaced by a precipitable one. In particular, the use of heavy metal and halogen ions, whose precipitation and dissolution can be controlled by the potential of the electrode, enables the conversion and integration of the detected current as shown below.[16,17]
When the sample is placed in the cell on the IDA side, the depositable material is placed in the cell on the macroelectrode side, and the electrolysis (pre-electrolysis) of the sample is performed by controlling the potential of one side of the IDA electrodes (Fig. 6-1 (b)), a deposition reaction is induced at the macroelectrode due to self-induced redox cycling. The deposition is equal to the amount of electrolysis of the sample at the IDA electrode, according to the law of conservation of electric charge.
In other words, the detection current of the sample could be converted into a deposition current of another substance. Furthermore, prolonged electrolysis of the sample results in a large amount of deposition, since the deposition reaction continues at the macroelectrode as long as the electrolysis of the sample continues. This means that the detected current could be time integrated. The amount of material deposited on the macroelectrode can be quantified by the conventional stripping method (Fig. 6-1 (c)).
This is done by measuring the current peak obtained when the potential of the macroelectrode is swept. From the peak area, the total deposition and thus the total amount of electrolysis of the sample can be quantified. Assuming that a constant current is flowing during pre-electrolysis of the sample, the concentration of the sample can be determined from the limiting current values determined by the total amount of electrolysis, the pre-electrolysis time and the shape of the IDA electrode.
This analysis method converts the detected current of the sample into the deposition current of another substance, and the deosited substance is subjected to normal stripping analysis, allows the determination of reversible redox substances at very low concentrations due to a two-step current amplification. That is, the first current amplification by redox cycle and the second amplification effect by time integration of deposited substances.
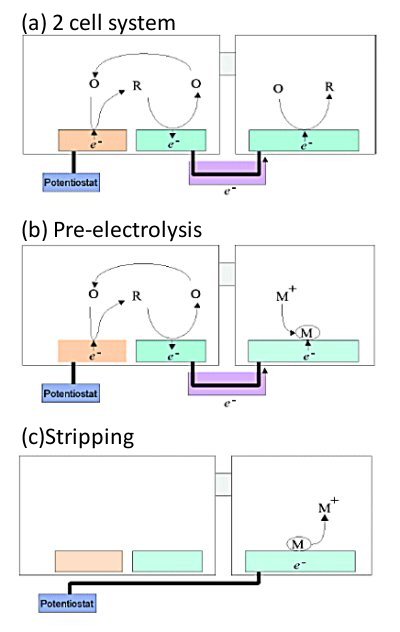
The cell was separated into two and electrically connected between them by a salt bridge. IDA electrode was placed in the left cell and a macroelectrode in the right cell.
(a) A self-induced redox cycle is also expressed in the two-cell system, and the current flowing between the IDA shaped electrode and the macro-electrode can be observed.
(b) Even if the redox substance in the right cell is changed to a substance that deposits on the electrode, such as heavy metal ions, the self-induced redox cycle still occurs, and the amount of reaction in the left cell is equal to the amount of deposition in the right cell.
(c) By controlling the potential of the macroelectrode, the heavy metal ions deposited in (b) can be dissolved. The amount of dissolution is equal to the amount of reaction performed in the left cell.
Part 7: Application
7.1 Measurement of oxidized standard substances
As an example of the measurement of conversion stripping, the detection of ruthenium hexamine is described. Ruthenium hexamine is a reversible redox substance dissolved in an oxidized state and is suitable as a standard substance for the conversion stripping method.
Fig. 7-1 shows a block diagram of the measurement system.
The measurement cell consisted of a Teflon beaker connected by a salt bridge. The salt bridge was a glass tube filled with saturated potassium nitrate solution and sealed at both ends with Vycor glass. IDA, Ag/AgCl reference electrode, and Pt counter electrode were placed in the left cell for the sample, and a glassy carbon (GC) electrode was placed as a macroelectrode in the right cell for the deposited material. The reference and counter electrodes were connected to the specified terminals of the potentiostat, while the two electrode terminals of the IDA electrode and the GC electrode terminal were connected to the working electrode terminal of the potentiostat through a switch box.
This switch box is used to switch between the pre-electrolysis and stripping phases. In the pre-electrolysis phase, one IDA working electrode (generator) is connected to the potentiostat and the other working electrode (collector) is connected to the macroelectrode, while in the stripping phase, the circuit is set up to connect the macroelectrode to the potentiostat.
The samples were prepared by dissolving ruthenium hexamine in pH 4 standard buffer solutions. The solution for deposition was silver nitrate dissolved in potassium nitrate solution (0.1 mol/dm3). The detection of ruthenium hexamine by the conversion stripping method was performed in two steps as follows.
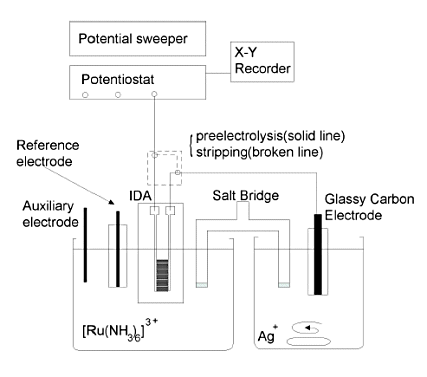
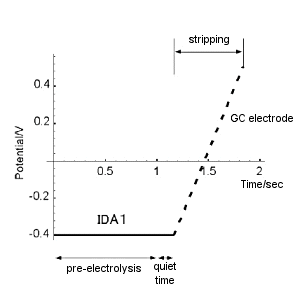
As shown in Fig. 7-2, during the first pre-electrolysis step, the generator potential was set sufficiently lower than the redox potential of ruthenium hexamine (-0.4 V in the figure) and the electrolysis of ruthenium hexamine was continued. During this time, the silver nitrate solution was continuously stirred. After a preset time (pre-electrolysis time), the stirring was stopped, and after 10 sec of quiet time, the switch was immediately switched to perform the second step of stripping. During stripping, the GC electrode potential was swept from -0.4 V to 0.5 V at a scan rate of 20 mV/S. The potential-current curve of the GC electrode (conversion stripping voltammogram) was recorded on a recorder. The obtained conversion stripping voltammogram of ruthenium hexamine is shown in Fig. 7-3.
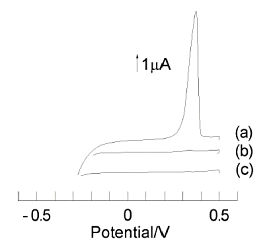
(a) Pre-electrolysis of a solution containing ruthenium hexamine at -0.4 V for 10 min.
(b) Pre-electrolysis of a solution containing ruthenium hexamine at 0 V for 10 min.
(c) Pre-electrolysis of a solution without ruthenium hexamine at -0.4 V for 10 min.
All potential sweeps were 20 mV/sec
The concentration of ruthenium hexamine is 1 µmol/dm3. (a) was a stripping voltammogram of silver ions obtained after 10 min of pre-electrolysis of ruthenium hexamine at -0.4 V. In contrast, (b) was obtained after pre-electrolysis at 0 V for 10 min. (c) was obtained after 10 min of pre-electrolysis at -0.4 V in a solution without ruthenium hexamine.
A large silver stripping peak was observed only when ruthenium hexamine was present and the electrolysis was being performed. A recorder was inserted between the collector and the GC electrode to monitor the current flowing during the pre-electrolysis step, and it was confirmed that a steady state was reached about 30 sec after the start of pre-electrolysis.
From the above, it is clear that in the conversion stripping method, ruthenium hexamine in the left cell is reduced by the generator, the reduced product generated is oxidized by the collector, and the electrons generated by the oxidation reaction are used to deposit silver ions in the right cell. The electrons generated by the oxidation reaction are used for the deposition of silver ions in the right cell. The oxidized product generated in the collector is again reduced in the generator to form a self-induced redox cycle, and the current flowing between the collector and GC is found to be steady-state.
Therefore, the amount of silver deposited is proportional to the pre-electrolysis time, indicating that a long pre-electrolysis time is effective for detecting low concentrations.
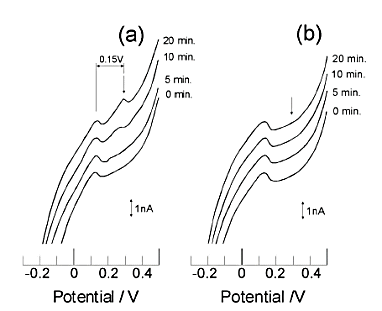
(a) Measured in solution containing ruthenium hexamine.
(b) measured in solution without ruthenium hexamine.
The number to the right of each voltammogram indicates the pre-electrolysis time.
A peak at 0.3 V indicates the detection of ruthenium hexamine.
Fig. 7-4 shows the results of applying conversion stripping to 10 pmol/dm3 of ruthenium hexamine[18]. In order to observe a smaller stripping peak, the conditions such as GC electrode area and silver ion concentration are different from those in Fig. 7-3 (a) is a voltammogram obtained from a solution containing ruthenium hexamine and (b) is a voltammogram obtained from a solution without ruthenium hexamine. A pre-electrolysis time-dependent stripping peak was observed at 0.3 V, in (a), whereas no corresponding peak was observed in (b). Also, Fig. 7-5 shows the calibration curve for the conversion stripping method[19].
The horizontal axis is the concentration of ruthenium hexamine and the vertical axis is the magnitude of the stripping peak obtained at a pre-electrolysis time of 10 min. The detection method showed good linearity in thep mol/dm3 region. The solid line in the figure is the calculated value obtained from the limit current [14] and peak width of the IDA electrode, which is in good agreement with the experimental value.
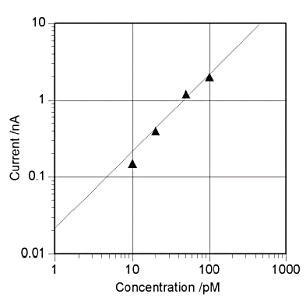
Pre-electrolysis time is 10 min. Solid line is calculated value.
The conversion stripping method can obtain a very large detection current compared to that obtained by the normal electrochemical detection method. Although the IDA electrode used in the conversion stripping method cannot detect 10 pmol/dm3 of ruthenium hexamine using the normal electrochemical detection method, the limiting current value in the twin mode is 0.8 pA when evaluated using calculated values[5]. In contrast, the measured value of the peak obtained after 20 minutes of pre-electrolysis by the conversion stripping method is 0.5 nA, which means that a detection signal 630 times higher was obtained. Furthermore, in the single electrode, where the redox cycle effect is not available, the amplification effect is even greater because the detected current is as low as 10%.
Part 7: Application
7.2 Measurement of reduced standard samples
So far, we have described examples of applying conversion stripping to redox substances dissolved in an oxidized state, but the conversion stripping method can also be applied to reversible redox substances dissolved in a reduced state. The results of applying a water-soluble ferrocene suitable for conversion stripping as a standard dissolved in the reduced state are described below.
The mechanism and method of detection of water-soluble ferrocene by the conversion stripping method is similar to that for ruthenium hexamine. The difference is that the oxidation and reduction reactions are reversed, and accordingly, the direction of electrons is also reversed. As shown in Fig. 7-6, in the pre-electrolysis stage, the oxidation reaction occurs in the generator and the reduction reaction occurs in the collector, and the electrons required for the reduction reaction in the collector must be supplied from the macroelectrode.
This is possible by choosing halogen ions as the substance to be deposited on the macroelectrode. In the experiment, iodine ions with appropriate deposition potential were used. A silver electrode was used as the macroelectrode for depositing the iodine ions. In the stripping stage, the dissolution current of iodine ions is observed by observing the cathodic current (convex peak at the bottom) when the macroelectrode potential is swept from positive to negative.
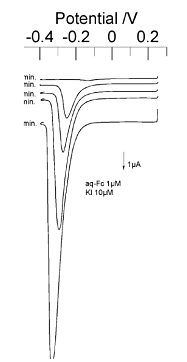
Fig. 7-6 shows an example of water-soluble ferrocene detected by the conversion stripping method. The concentration of water-soluble ferrocene was 1 µmol/dm3 dissolved in a phosphate buffer solution at pH 7.0.
The solution for deposition was potassium iodide dissolved in 0.1 mmol/dm3 potassium nitrate solution with a concentration of 1 µmol/dm3. A large peak of cathodic current was observed depending on the pre-electrolysis time, whereas this peak was not observed in the experiment without water-soluble ferrocene.
From this, it is confirmed that iodine ions are deposited on the macroelectrode during the electrolysis of water-soluble ferrocene, and the deposited iodine ions dissolve in the stripping step.The law was shown to be effective.
So far, we have seen the possibility of detecting trace substances using the conversion stripping method as a quantitative analysis technique, but the conversion stripping method also has the possibility of being a qualitative analysis technique for trace substances.
Fig. 7-7 plots the stripping peaks obtained for the conversion stripping of water-soluble ferrocene as a function of pre-electrolytic potential. When the pre-electrolysis potential is lower than the redox potential of water-soluble ferrocene, no stripping peak appears, but as the pre-electrolysis potential approaches the redox potential, the peak becomes larger, and at pre-electrolysis potentials sufficiently higher than the redox potential, the peak size is constant.
The measurements can be fitted with a sigmoidal function. The fitting parameter, which stands for the redox potential, was determined to be 0.38 V by the nonlinear least squares method, which agreed with the value of the redox potential of water-soluble ferrocene.
This measurement is equivalent to cyclic voltammetry with a IDA electrode in twin mode, but the detection current is amplified to a very large extent, indicating that cyclic voltammetry measurement of low concentration samples is possible.
However, this measurement requires a long measurement time because a pre-electrolysis must be performed for each point obtained. This can be solved by performing conversion stripping with an electrode system consisting of many pairs of IDA shaped electrodes and macroelectrodes.
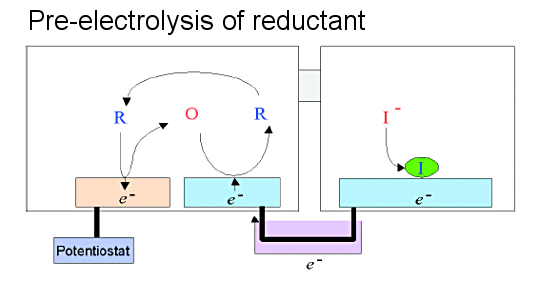
Fig. 7-6 Pre-electrolysis mechanism for a reversible redox substance dissolved in a reduced state. The oxidation and reduction reactions at each electrode are opposite when the substance is dissolved in an oxidized state. The direction of the current flowing between the IDA electrode and the macroelectrode is also opposite. The deposited substance is an anion.
Part 7: Application
7.3 Analysis of micro volume sample
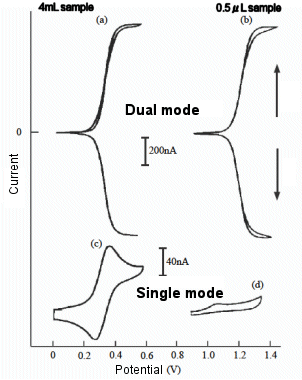
In a redox cycle of reversible reactive species on an IDA electrode, most of the molecules reacted on one electrode are returned to their original state by a reverse reaction on the other electrode. Therefore, even when the amount of solution is extremaly small compared to the electrode area, the measurement can be performed stably without changing the concentration of reactive species in the sample due to electrochemical reactions. We fabricated a micro electrochemical cell of 2 mm square by integrating a reference electrode and a counter electrode on a IDA electrode. The reference electrode was made by plating silver on the electrodes other than the IDA electrode formed on the substrate. The IDA electrode cell was thinned to a volume of less than 1 microliter using a Teflon gasket and a glass plate.
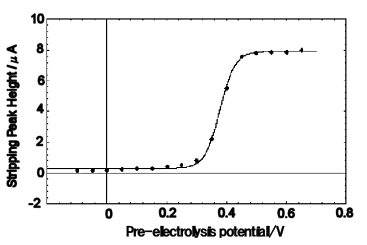
1µ mol/dm3 water-soluble ferrocene was pre-electrolyzed for 5 minutes by changing the pre-electrolysis potential.
Solid lines are fitted with sigmoidal functions.
Fig. 7-9 shows the voltammograms of a ferrocene derivative solution with a sample volume of 500 nL measured in a micro IDA electrochemical cell, compared to the results obtained with a larger sample volume. When the reduction potential of ferrocene is applied to one electrode and the other electrode is swept, a large steady-state current is obtained even with a very small sample volume, but when only one electrode is used for measurement, the current value is very small, and this difference is more pronounced than when the sample volume is large. This result indicates that when only one electrode is used for measurement, the active species are rapidly consumed by the electrochemical reaction. On the other hand, when two electrodes are used for the measurement and the potentials are applied independently so that a redox cycle occurs, the micro IDA electrode has a high capture rate and the ferrocene derivative is oxidized at the G-pole and immediately reduced at the C-pole, thus reducing the consumption of the reductant.
The micro IDA electrode cell was used as a detector in an electrochemical enzyme immunoassay to measure para-aminophenol, a product of the enzymatic reaction. As a result, the same quantitative performance was obtained with a sample volume of less than a microliter as with a larger sample volume. It was also found that the measurable time was reached after a short incubation time (enzyme reaction time) due to the small solution volume [21].
Part 7: Application
7.4 Highly sensitive and selective detection of dopamine
It has been described that the miniaturization of the electrode width and gap of the IDA electrodes enables highly accurate measurement, improves sensitivity, and is expected to increase response speed. In order to demonstrate the above, the results of the investigations on dopamine, one of the catecholamines that exist in trace amounts in living organisms and play an important role, will be described[22].
Compared to typical reversible substances such as ferrocene, dopamine has a slow electron transfer rate that causes electrode reactions, and it is also more unstable (under high pH), which can easily cause changes over time due to chemical reactions following electrochemical reactions. Therefore, by using such microelectrodes, the redox species generated at the G-pole can be captured at the C-pole in an extremely short time, so that an unstable intermediate can be captured and the effect of returning it to its original state can be remarkably exhibited.
Fig. 7-10 shows CV measurements of dopamine in GC mode and O mode. In O-mode, which is the usual measurement method, the peak waveform is asymmetric, but in GC mode, a large limiting current is observed, indicating the possibility of high-sensitivity measurement.
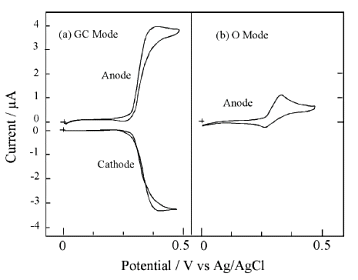
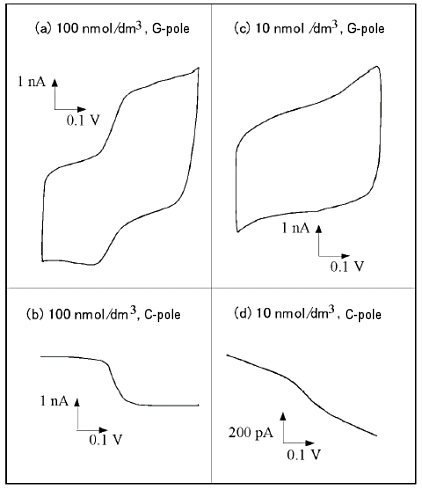
Fig. 7-11 shows an example of measurement at low concentrations. At 100 nM, a quantifiable curve can be observed even at the anode of the G-pole, and a clean limiting current is observed at the C-pole without charging current noise.
At 10 nM, an order of magnitude lower concentration, no quantitative curve could be obtained on the anode side, but quantifiable measurements could be made on the cathode side, although a baseline slope due to residual current was observed. The limiting currents associated with redox were observed over a wide concentration range, and a good linear relationship between concentration and current was observed (Fig. 7-12). This suggests that the micro IDA electrode is effective for quantitative detection of trace components.
Although it was shown that highly sensitive detection is possible in the measurement of dopamine, in actual systems, a large amount of L-ascorbic acid coexists, which interferes with the measurement. The reaction in such a system is complex: dopamine is first oxidized, but is immediately reduced by the coexisting ascorbic acid, making selective detection with a conventional electrode impossible.
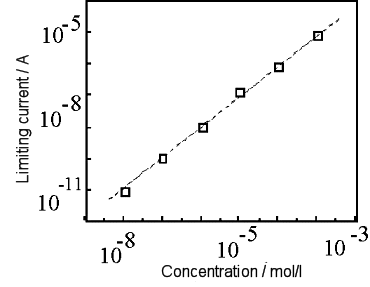
Fig. 7-13 shows cyclic voltammograms using two types of interdigitated electrodes of different sizes, in comparison with the case where dopamine alone and ascorbic acid coexist. In the case of the relatively large IDA electrode (10 µm electrode width, 5 µm gap), a limiting current is observed on both the oxidizing and reducing sides in the case of dopamine alone (a). In the system in which dopamine coexists with 6 times the amount of ascorbic acid, no clear signal is observed even on the reducing side with low noise, and a peak mediated by ascorbic acid on the oxidizing side and an oxidation peak of ascorbic acid itself are observed (b), making selective detection of dopamine impossible. This means that with the size electrode used here, the oxidizing species is altered by subsequent reactions while diffusing to the reducing electrode.
On the other hand, as shown on the right side of Fig. 7-13, for smaller electrodes size (3 µm electrode width, 2 µm gap), the limiting current of dopamine can be observed even in mixed systems, indicating that dopamine oxidizing species are detected at the reducing electrode before they change (d).
Such selectivity is clearly dependent on the electrode shape, and is expected to increase with decreasing the size of the electrode. Further selective detection can be expected by the selectivity of the micro IDA electrode itself and the modification of the polymer membrane.
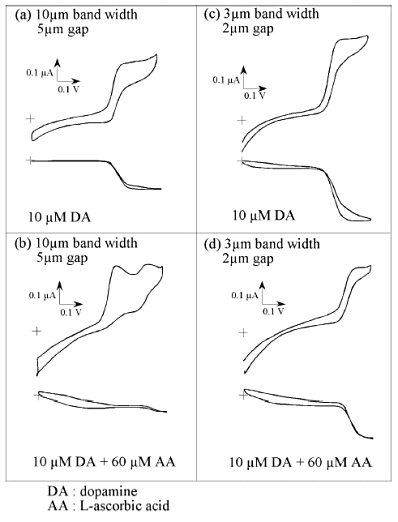
Fig. 7-14 shows the results of selective detection of dopamine using a comb electrode modified with a bilayer membrane consisting of Nafion (upper layer), which has excellent dopamine selectivity, and polyester ionomer (lower layer), which has high dopamine diffusion inside the membrane 23. In the sample, L-ascorbic acid is present in concentrations ranging from 0 to 100 times the concentration of dopamine.
The measurement was performed by applying the reduction potential of dopamine to the C-pole of a IDA electrode and stepping the G-pole from 0 V to the oxidation potential of dopamine. In the absence of ascorbic acid in the sample, the current at the C-pole reached a steady state immediately after the potential step, indicating that the oxidized dopamine diffused rapidly through the membrane. On the other hand, when the electrode was modified with Nafion alone, the fast response was not obtained and the absolute value of the current decreased due to the low diffusion rate of dopamine in the membrane.
Next, in the sample containing excess ascorbic acid, the current at the C-pole is low at first, but increases after a few seconds and is almost identical to the value obtained for the sample without ascorbic acid. Immediately after the potential is applied, most of the dopamine oxidized at the G-pole is reduced before reaching the C-pole due to the presence of L-ascorbic acid in the lower film, which has a low selectivity. However, due to the Nafion membrane, only a small amount of ascorbic acid is supplied into the membrane from the solution, resulting in a rapid decrease in the membrane concentration.
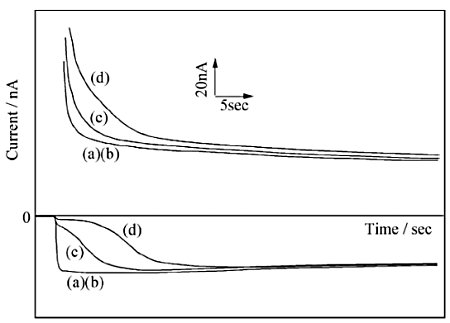
a: 0 µM, b: 200 µM, c: 600 µM, d: 1000 µM L-ascorbic acid in 10 µM Dopamine
On the other hand, dopamine, which is reversible, is regenerated in the C-polar reaction and has high selectivity because its concentration does not change.
Part 7: Application
7.5 Application to liquid chromatography detector
High performance liquid chromatography with electrochemical detection (HPLC-EC) is known as a highly sensitive method along with luminescence and fluorescence detection. Electrochemical measurements with iIDA electrodes in a flow system are less effective than measurements in a static system because the flow reduces the number of redox cycles. However, in recent years, a very small column of 1 mm or less is used for the measurement of biological samples, etc., and in that case, the flow rate is much lower than before, so it is effective to use an IDA electrode as a detector.
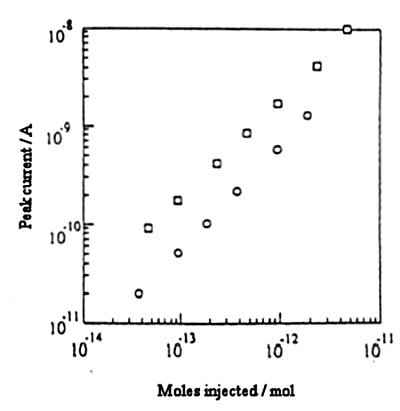
⃝: 3 mm diameter column ⃞: 1 mm diameter microbore column
Fig. 7-15 shows the relationship between the amount of dopamine injected and the current value when a IDA electrode detector is connected to a 3 mm diameter column and a 1 mm microbore column for measurement. By measuring at a low flow rate in the microbore column, a large current value is obtained with the IDA electrode detector.
Conventionally, metals such as gold and platinum have been used for such thin-film microelectrode detectors. Although metals are suitable for microfabrication, but because of their small overvoltage against the reduction of hydrogen and oxygen, there are problems such as low sensitivity on the reduction side when used for chromatography detectors.
Recently, we have established a thermal CVD process for organic compounds and its microfabrication process to fabricate carbon IDA electrodes with micron-order patterns.
By using this electrode in the chromatographic detector, a low detection limit of 100 pM concentration (less than 1 fmol absolute) was obtained for dopamine.
Part 8: Conclusion
The advent of microelectrodes has enabled electrochemistry, which was previously limited to conductive solutions, to be measured in nonpolar, low-conductivity solvents and solids such as ion-conductive polymers. Furthermore, as in this study, the electrode geometry has been modified to provide a wide variety of measurement variations such as higher sensitivity, higher speed, and selectivity. On the basis of these developments, many applications are expected, such as detectors for HPLC and flow cells, or biosensors by modification with enzymes or immunoassays.
Reference:
[1] M. Fleischmann, S. Ponds, D. Roison and P. P. Schmidt, Ultramicroelectrodes, Morganton, N.C., 1987.
[2] S. Ponds and M. Flieschmann, Anal. Chem., 59, 1391A (1987).
[3] D. C. Johnson, M. D. Ryan and G. S. Wilson, Anal. Chem., 60, 147R (1988).
[4] K. Aoki, Electrochemistry, 56, 608 (1988).
[5] J. Janata and A. Bezegh, Anal. Chem., 60, 62R (1988).
[6] J. O. Howell and R. M. Wightman, J. Phys. Chem., 88, 3915 (1984).
[7] L. Geng, A. G. Ewing, J. C. Jernigan and R. W. Murray, Anal.Chem., 54, 852 (1986).
[8] H. S. White, G. P. Kittlesen and M. S. Wrighton, J. Am. Chem. Soc., 106, 5375 (1984).
[9] G. P. Kittlesen, H. S. White and M. S. Wrighton, J. Am. Chem. Soc., 106, 7389 (1984).
[10] E. T. T. Jones, O. M. Chyan and M. S. Wrighton, J. Am. Chem. Soc., 109, 5526 (1987).
[11] H. Tabei, M. Morita, O. Niwa and T. Horiuchi, J. Electroanal. Chem., 334, 25 (1992).
[12] K. Aoki, M. Morita, O. Niwa and H. Tabei, J. Electroanal. Chem., 256(2), 269 (1988).
[13] O. Niwa, M. Morita and H. Tabei, Anal. Chem., 62, 447 (1990).
[14] T. Horiuchi, O. Niwa, M. Morita and H. Tabei, J. Electrochem. Soc., 138, 3549 (1991).
[15] T. Horiuchi, O. Niwa, M. Morita and H. Tabei , Anal. Chem., 64, 24, 3206 (1992).
[16] T. Horiuchi, O. Niwa, M. Morita and H. Tabei, Denki Kagaku, 60, 1130 (1992).
[17] T. Horiuchi, O. Niwa, M. Morita and H. Tabei, 183rd Meeting of the Electrochemical Society, 1714 (1993).
[18] O. Niwa, M. Morita and H. Tabei, Sensors & Actuators B, 14(1-3), 558 (1993).
[19] O. Niwa, Y. Xu, H. B. Halsall and W. R. Heineman, Anal. Chem., 65, 1559 (1993).
[20] O. Niwa, M. Morita and H. Tabei, Electroanalysis, 3, 163 (1991).
[21] M. Takahashi, M. Morita, O. Niwa and H. Tabei, J. Electroanal. Chem., 335, 253 (1992).
[22] M. Takahashi, M. Morita, O. Niwa and H. Tabei, Sensors & Actuators B, 13-14, 336 (1993).

