Part 18: Impedance-Time (IMPT)
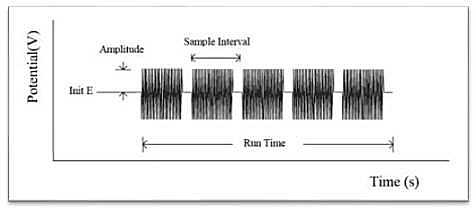
The impedance-time method holds the base potential at the initial potential. A sine wave is superimposed on the base potential. Current and voltage are sampled and analyzed for real and imaginary impedance components. The impedance is recorded as a function of time. The following figure shows the applied potential waveform as a function of time.

Fig. 18-1 Potential waveform of the impedance-time method.

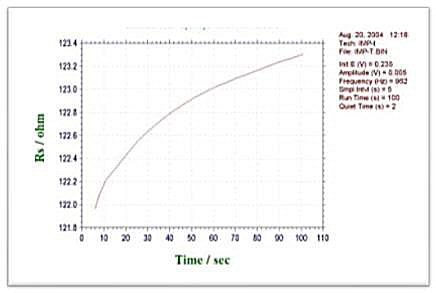
Fig. 18-2 Typical impedance-time plot.
-Types of data that can be plotted
- LogZ - t
- phase - t
- Z - t
- Z' - t
- Z" - t
- log(Z" & Z') - t
- logY - t
- Y - t
- Y' - t
- Y" - t
- log(Y' & Y") - t
- Rs - t
- Os - t
- Rp - t
- Cp - t

