
Electrochemical Measurement Electrode Handbook
INDEX
- Section 1: Chronocoulometry
- Section 2: Cyclic voltammetry
- Section 3: Electrode for cyclic voltammetry (CV)
- Section 4: Reference electrode
- Section 5: Measurement of small amount sample
- Section 1: Chronocoulometry
- Section 2: Cyclic voltammetry
- Section 3: Electrode for cyclic voltammetry (CV)
- Section 4: Reference electrode
- Section 5: Measurement of small amount sample
- Section 6. Polishing method
Section 1: Chronocoulometry (electrochemical measurement technique)
1-1 Summary
In electrochemical measurement, the technique of measuring the current response to time caused by the application of a potential step is called chronoamperometry.
Furthermore, the technique of measuring the amount of charge integrated over this amount of current is called chronocoulometry.
The reason why the shape of the chronocoulogram (charge-time curve) is the way it is can be understood by considering the concentration gradient in the solution near the electrode.
Chronocoulometry is:
- Electrode surface area
- Diffusion coefficient
- Time window of an electrochemical cell (time range that can be effectively used for accurate measurements)
- Electrochemical adsorption of active species
It is useful for measuring such as, and estimating the rate constant and reaction mechanism of the preceding or following chemical reaction.
1-2 Introduction
Chronocoulometry is one of the standard electrochemical measurements frequently used in the field of electroanalytical chemistry.
As the name suggests, chronocoulometry measures the amount of electric charge (coulomb) against time (chrono).
- Electrode surface area
- Diffusion coefficient
- Measurement of concentration
- Discussion of kinetics and reaction mechanism of continuous chemical reaction
- Electrode charge transfer rate
- Adsorption
- Measurement of the effective time width of an electrochemical cell
It can be performed by this fundamental and versatile method.
1-3 Applied voltage waveform
Chronocoulometry, one of the electrochemical measurement methods, changes the electric potential applied to the cell in steps.
The potential waveform is shown in Fig. 1-1A. The initial potential is changed stepwise from Ei to Es.
- Ei is the potential at which electrolysis does not occur, and Es is the potential at which oxidation or reduction occurs.
- The experiment ending with Es is called single potential step chronocoulometry, while in double potential step chronocoulometry the potential is changed to a third value, Ef.
- Ei and Ef are often chosen to have the same value. The change from Ei to Es is called the forward potential step, and the change from Es to Ef is called the reverse step.
- Just as Es is chosen to be the potential at which electrolysis occurs, Ef is chosen to be the potential at which electrolysis of the product occurs during Es.
- To understand chronocoulometry, it is helpful to consider how the concentration distribution at the electrode interface looks when a stepped potential is applied. The Nernst equation expresses the relationship between the electrode potential and the concentration of the reversible redox system on the electrode surface.
The following equation (1) is the Nernst equation for a redox system and is given by equation (2) (25 °C).

Eq. (2)

Fig. 1-1 Chronocoulogram.
where: E is the electrode potential, E0R‚O is the standard redox potential, n is the number of electrons, C0O and C0R are the surface concentrations of oxidized and reduced substances, respectively.
From equation (2), it can seen that the surface concentration ratio C0R/C0O changes as the electrode potential changes. The change is accompanied by the reduction of the oxidant or the oxidation of the reductant at the electrode surface, resulting in the flow of electrons, or current, in the circuit.
Table 1-1 shows how the C0R/C0O changes as the potential changes from the standard potential, and it can be seen that the surface concentration ratio changes significantly for potential changes below 500 mV.
| CSR/CSO | E (mV) | |
| n = 1 | n = 2 | |
| 1/10,000 | 236 | 118 |
| 1/1000 | 177 | 88.5 |
| 1/100 | 118 | 59 |
| 1/10 | 59 | 29.5 |
| 1 | 0 | 0 |
| 10/1 | -59 | -29.5 |
| 100/1 | -118 | -59 |
| 1000/1 | -177 | -88.5 |
| 10,000/1 | -236 | -118 |
1-4 Concentration-distance (C-d) profile
In chronocoulometry, one of the electrochemical measurement techniques, the variation of surface concentration associated with a potential step creates a concentration gradient near the electrode. The gradient is represented as a concentration-distance profile as shown in Fig. 1-2. For example, consider a solution containing 1 mM of oxidant (O) and a supporting electrolyte, where Ei is chosen positive enough for E0R‚O that the reduction of O does not occur. The concentration of O in Fig. 1-2A is constant from the surface to the offshore of the solution, while the concentration of R in Fig. 1-2B is constant (low enough to be considered zero in the figure). ES is chosen to be negative enough for E0R‚O that all O on the surface is reduced to R.
As a result of the potential step ES, the concentration gradient is shown in Fig. 1-2a, b. The concentration gradient drives the diffusion of the oxide from offshore to the surface. The concentration gradient is the driving force for the diffusion of the oxide from the offshore to the surface, and the diffuse layer extends offshore with time as shown in c and d. As O disappears, R accumulates near the electrode, and the time evolution of the concentration gradient of R is shown in b, c, and d in Fig. 1-2B.
R diffuses from the electrode to the offshore direction, contrary to O. In any case, it diffuses from the high concentration side to the low concentration side. It is important to note that in order to obtain the profile shown in Fig. 1-2, the mass transfer occurs only by diffusion, and the solution must be kept quiet so that convection does not occur.
What happens when we step to a sufficiently positive potential (for E0R‚O), Ef, where CSR becomes zero? Considering equation (2), we can see that the ratio CSR/CSO immediately becomes small.
Therefore, the R produced during the forward potential step is oxidized back to O during the reverse step. The concentration-distance profiles in Fig. 1-2C and D show that some of the R diffuses back to the electrode surface and is oxidized to O. The rest of the R diffuses into the solution, which means that not all of the O is recovered by the reoxidation of R.

Fig. 1-2 Transition of concentration-distance profile caused by potential step.
A, B: Oxidized (O) and reduced (R) compounds in the forward step
C, D: Oxidized (O) and reduced (R) compounds during the reverse step
1-5 Current response
In chronocoulometry, one of the electrochemical measurement techniques, the potential step response is the current due to the electrolysis of O or R shown in equation (1). The current is proportional to the gradient of the C-d profile at the electrode surface for the reduction of O, as shown in equation (3) below.

Eq. (3)
where i is the current (A), n is the number of reacting electrons (eq/mol), F is Faraday’s constant (96,485 C/eq), A is the electrode area (cm2), CO is the concentration of O (mol/cm3), DO is the diffusion coefficient of O (cm2/s), and t is the time (s).
Using equation (3), we can predict the shape of the current-time response from the slope of the C-d profile at x = 0 (electrode surface) of the component being electrolyzed.
Chronoamperometry is a time-varying measurement of current. The chronoamperogram is the current-time response to a potential step. A chronoamperogram for a double potential step is shown in Fig. 1-1B.
When the potential is stepped from Ei to ES, a large cathode current immediately flows and slowly decays. Consider how this response corresponds to the slope of the C-d profile for O in Fig. 1-2A.
When the potential is returned to Ef, a large anode current immediately flows and slowly decays. This response also corresponds to the gradient of the C-d profile against R in Fig. 1-2D. The current is a measure of the rate at which a component is electrolyzed at the electrode surface. In the experiment described above, electrolysis is governed by the rate at which O or R (at the forward or reverse step, respectively) arrives at the electrode surface, that is mass transfer by diffusion. The decay of the i-t curve after the potential step reflects the fact that the arrival rate of O (or R ) also decreases as the concentration in the vicinity of the electrode decreases. In other words, O (or R) has to travel a longer distance over time to reach the electrode as the experiment progresses. The following Cottrell equation represents the current-time curve for chronoamperometry. Note that the current decreases as a function of t-1/2.

Eq. (4)
1-6 Charge response
Chronocoulometry
One of the electrochemical measurement techniques, chrono-amperometry is basically chronoamperometry, but it is a measurement method that takes another step from chronoamperometry. It integrates the current over time to obtain the charge (Q) response over time. Therefore, chrono-amperometry gives the same potential perturbation as chronoamperometry. The resulting Q-t curve is given by the integral of equation (4) over the forward step (equation (5)).

Eq. (5)
Double potential step chronocoulometry
A typical result obtained by double potential step chronocoulometry is shown in Fig. 1-1C. It is just a mathematical integration of Fig. 1-1B.
As can be seen from equation (5), Q increases as a function of t1/2 during the forward step. The value of Q at a given point corresponds to the total amount of O reduced by that time (equal to the amount of R produced). Therefore, i is a measure of the electrolysis rate at a certain point in time, while Q is a measure of the amount of substance that has been electrolyzed by that time.
At time τ, the potential is stepped back in the original direction and the anodic reaction is started. The result is the charge (Qr) for the oxidation reaction of R subtracted from the final value of Q in the forward step (Qf in Fig. 1-2C, which is the baseline in the reverse step). The formula that applies to the reverse step is shown in equation (6) below.

Eq. (6)
1-7 Selection of Ei and Es by Cyclic Voltammetry

Fig. 1-3 Cyclic voltammogram of reversible system (EO = 0 V, n = 1)
The choice of Ei and Es is an important aspect of chronocoulometry experiments, which can be somewhat difficult in redox systems where E0R‚O are not specified. In this case, cyclic voltammetry measurements can be performed in advance to determine the potential range of the redox pair at the working electrode and the supporting electrolyte system used.
A typical cyclic voltammogram of a reversible system is shown in Fig. 1-3, where only O is in solution, E0R‚O are assumed to be zero volts, and a one-electron process is considered. As can be seen from Table 1, when stepping from Ei = +118 mV to Es = -118 mV, the surface concentration ratio C0R/C0O changes from 1/100 to 100/1.
This change is sufficient to make the surface concentration of O virtually zero, and equation (5) (section, 1-6 Charge response) holds. In order for the concentration ratio to change sufficiently so that the surface concentration of O is indeed “virtually zero”, a larger potential change should be applied if possible. For example, a change from +177 mV to -177 mV will give a change in concentration ratio from 1/1000 to 1000/1.
1-8 Evaluation of electrochemical cell
One of the useful applications of chronocoulometry, an electrochemical measurement technique, is to determine the time width over which planar diffusion (one-dimensional diffusion) occurs in the electrochemical cell used.
Equation (5) (section 1-6 Charge response) is calculated based on the assumption that the electrode is flat, that the potential change occurs instantaneously, and that the mass transfer of electrochemically active species to the electrode surface occurs only by diffusion, with no contribution from convection. As can be seen from equation (5), Q/t1/2 is constant.
When this value is plotted against time, it becomes as shown in Fig. 1-4, which is constant over a wide time range, and this time range represents the time frame in which the condition of planar diffusion is satisfied. The increasing trend after a long period of time is due to a small contribution from convection, probably as a result of oscillations. Such a small convection contribution is sufficient to take the measurement after about a minute, even in a cell protected from vibration.
Another reason for the increasing trend is the contribution of spherical diffusion caused by the suspended mercury dropping electrode. In such electrodes, flat diffusion can be considered only up to about one second, after which spherical diffusion is mixed. There is a decreasing trend in a short time. This is due to the fact that the potentiostat is not perfectly capable of changing the cell potential instantaneously.
The uncompensated solution resistance between the electrodes causes a time delay in the potential change of the cell. Therefore, the ratio C0R/C0O does not change instantaneously. As a result, the current value is slightly smaller than the theoretical value and the Q value is also smaller until the potential reaches the set value. The time required for a cell potential change is typically microseconds to milliseconds. This time can be shortened by minimizing the uncompensable solution resistance between electrodes. Bringing the reference electrode and the working electrode as close together as possible, increasing the supporting electrolyte concentration, and reducing the electrode area will help reduce the time delay in the cell response.

Fig. 1-4 Example of a plot of Q/t1/2.
1-9 Measurement of A, D, n, C
As can be seen from equation (5), A, D, n, and C can be calculated from Q/t1/2. Chronocoulometry is a standard method for determining the electrode surface area using a system with known D, n, and C, such as the ferrocyanide - ferricyanide system. If the surface area is determined in this way, the diffusion coefficient can be measured from chronocoulometry. In this case, n and C must be known. The values of n is usually obtained from thin-layer coulometry, peak-to-peak potential difference in cyclic voltammetry, E vs. logi/(id-i) plot in polarography, or the rotating electrode method. It can also be obtained from Q/t1/2 assuming a reasonable value of D.
While the potential step method is certainly an important part of the electrochemical analysis methods typically used for quantitative analysis (e.g., pulse voltammetry), chronocoulometry has relatively rarely been used to determine concentration C. One of the few cases where stripping voltammetry has been useful is when the stripping peak is a single peak. In particular, when multiple stripping peaks overlap rather than a single peak, setting the potential step to include all of them and integrating the current allows for a more accurate quantitative analysis.
1-10 Adsorption
Chronocoulometry is particularly suitable for studying electrochemically active species adsorbed on electrode surfaces. In fact, it was the study of adsorption that led to the development of this technique. The charge used to electrolyze the adsorbed species is distinguished from the charge used to electrolyze the components in the solution. That is, the adsorbed species is on the electrode and is instantly electrolyzed, while the solution species must diffuse to the electrode in order to be electrolyzed. As a result of the potential step, the total charge measured (Qtotal) consists of three contributions. That is,
(a) Charging of the electric double layer (Qdl)
(b) Electrolysis of adsorbed species (Qads)
(c) Electrolysis of solution species (Qdiff)
Where ΓO is the amount of O adsorbed (mol/cm3). The contribution of each component is shown in Fig. 1-5A, where Qdiff is expressed by Eq. 5 and the plot against t1/2 is a straight line.
")
The gradient is 2nFACODO1/2π-1/2. The second term in equations (7) and (8) is the charge from the adsorbed species. Since the adsorbed species are on the electrode, they are immediately electrolyzed by the potential step. Therefore, this term is time-independent and constant, as shown in Qads in Fig. 1-5A Qdl is the charge required to transfer the cell potential from Ei to Es. This term also occurs essentially instantaneously, as represented by Qdl in Fig. 1-5A.
(However, it is assumed that the electrode time in Fig. 1-4 is short.)
Qtotal is given by the addition of Qdiff, Qads and Qdl, as shown by the curve Qtotal in Fig. 1-5. As can be seen from equation (8), the plot of Qtotal against t1/2 is a straight line with the intercept equal to nFAΓO + Qdl as shown in Fig. 1-5B. If Qdl is known, ΓO can be calculated from the intercept for a known electrode at A. Qdl for a potential step from Ei to Es can be measured from an experiment involving only the supporting electrolyte.
However, this method assumes that Qdl is the same with or without the presence of adsorbed species, which may not be the case. The double potential step method may provide a better correction for Qdl.
 Charge-time curve of each component contributing to the total charge (Qtotal) in Equation 7.")
A) Charge-time curve of each component contributing to the total charge (Qtotal) in Equation (7).
 Plot of charge against (time) 1/2.")
B) Plot of charge against (time)1/2.
Fig. 1-6 shows the double potential step chronocoulometric plots for the two cases. For the forward step it is plotted against t1/2, and for the reverse step it is plotted against Τ + (t - Τ)1/2 - t1/2.
Plots 1 and 2 are for the case where neither reactants nor products are adsorbed and the intercepts of both plots are equal, corresponding to Qdl. Plots 3 and 4 are for adsorbed reactants and no adsorbed products. The intercept of plot 4 for the reverse step corresponds to Qdl even though there is adsorbed reactant. The intercept of plot 3 contains both Qdl and Qads because there is adsorbed reactant, and the difference between the intercepts of plots 3 and 4 equals Qads.

Fig. 1-6 Double potential step chronocoulometric plot in the presence of adsorption.
1,2; without adsorption of the reactive or productive species,
3,4; with adsorption of the reactive species and no adsorption of product species.
1-11 When chemical reactions are involved
Chronocoulometry, an electrochemical measurement technique, is suitable for the study of heterogeneous redox reactions that occur at electrodes (homogeneous chemical reactions accompanied by electrode charge transfer reactions, that is, preceding or following chemical reactions in solution). Such chemical reactions produce predictable and measurable changes in the Q-t response, providing information on the chemical reaction mechanism and kinetics. The study of subsequent chemical reactions, as shown in the following EC mechanism, is a good example of how chronocoulometry can be used.
R, formed by electrochemical reduction of O by a potential step from Ei to Es, is the reactive species and produces P with a reaction rate k. This mechanism is written as EC, where E comes from Electrode reaction and C from Chemical reaction. The homogeneous chemical reaction to produce P from R can be studied by double potential step chronocoulometry. Fig. 1-7 shows how the chronocoulogram of the EC mechanism changes depending on the reaction rate k. (k↑ is the direction in which the rate constant increases).

Fig. 1-7 Double potential step chronocoulogram with EC mechanism.
During the forward step, the chronocoulogram is not affected by subsequent chemical reactions. This is to be expected, as the mass transfer of O to the electrode surface depends on CO and DO, and not on what happens to the electrolytically generated R. (Of course, if R reacts and does not produce O, but it does, then another mechanism must be considered.)
The reverse step phase of the chronocoulogram is sensitive to the value of k. The value of k is obtained from the action curve consisting of dimensionless parameters calculated from the theory. The action curve for the EC mechanism is shown in Fig. 1-8.

Fig. 1-8 Action curve when EC mechanism is valid.
The curve shows how the ratio Qr/Qf varies as a function of (kΤ)1/2. Measure Qr/Qf for a potential step of period Τ, read the corresponding value of (kΤ)1/2 from the action curve, and calculate k. The shape of the action curve depends on the mechanism of the subsequent chemical reaction. As the rate constant of the chemical reaction increases, Qr decreases. The faster the chemical reaction, the smaller the Qr because less R is reoxidized to O during the reverse step.
1-12 Conclusion
Chronocoulometry, one of the electrochemical measurement techniques, is very useful and applicable to a variety of chemical systems.
Some of these advances are listed in the literature below.
Reference:
1) P.T.Kissinger and W.R.Heineman, eds., "Laboratory Techniques in Electroanalytical Chemistry", Marcel Dekker, New York, (1984).
2) P.T.Kissinger, Current Separation, 6(4) (1985) 62.
3) P.T.Kissinger and W.R.Heineman, J. Chem. Ed., 60 (1983) 702.
4) R.E.Shoup, Current Separation, 4(2) (1982) 31.
5) J.Y.Lewis, T.C.Pinkerton, E.Deutsch and W.R.Heineman, Anal. Chim.Acta, 167 (1985) 335.
6) J.H.Christie, G. Lauer, R.A.Osteryoung, Anal. Chem.,35 (1963) 1979.
7) J.H.Christie, G.Lauer, R.A.Osteryoung, J. Electroanal. Chem.,7 (1964) 60.
8) F.C.Anson, Anal. Chem., 38 (1966) 54.
9) J.H.Christie, R.A.Osteryoung and F.C.Anson, J. Electroanal. Chem.,13 (1967) 236.
10) F.C.Anson, J.H.Christie and R.A.Osteryoung, ibid, 13 (1967) 343.
11) A.J.Bard and L.R.Faulkner, "Electrochemical Methods", Wiley, New York (1980), p.199-206.
12) F.C.Anson and R.A.Osteryoung, J. Chem. Ed., 60 (1983) 293.
13) J.H.Christie, J. Electroanal. Chem., 13 (1967) 79.
Section 2: Cyclic voltammetry (electrochemical measurement technique)
2-1 Summary
Cyclic voltammetry (CV), one of the electrochemical measurement techniques, is a very popular measurement method for the initial evaluation of heterogeneous redox reactions. This chapter will introduces chemists to the CV measurement method.
Cyclic voltammetry (CV) is becoming more and more popular as an effective measurement method in a wide range of chemistry as a means of studying redox states. The electrode potential at which drugs, metal ions, complexes, proteins or other compounds are oxidized or reduced can be quickly determined by CV.
In addition, CVs provide information on the stability of the product of the electrode reaction. This information is useful for subsequent experiments such as LCEC, stripping voltammetry, electrolytic polymerization, corrosion, coulometry, etc. CV measurements are the first experiment to be carried out before electrical experiments using methods such as chronoamperometry, chronocoulometry, spectroelectrochemistry 1‚2), etc.
CV quickly became a popular method due to its effectiveness and convenience.
The effectiveness of CV is that it can quickly investigate redox reactivity over a wide potential range. The resulting voltammogram is similar to the spectrum obtained as a result of the energy scan.
An important aspect of the CV is that it can create a new redox species in the first scan and follow the disappearance of that species in subsequent scans. Therefore, CV is a powerful kinetics probe for monitoring reactive species. Since the potential scan rate can be changed, high-speed and low-speed chemical reactions can be investigated. Despite its wide range of applications, CV is not as commonly understood as other analytical methods such as spectroscopy and chromatography.
2-2 Fundamentals of CV
Cyclic voltammetry (CV) is an electrochemical measurement technique in which an electrode is immersed in a stationary sample solution and the current flowing through it is measured by repeatedly scanning the potential. The potential of the working electrode is controlled against a reference electrode such as a saturated caromel electrode (SCE) or a silver chloride electrode (Ag / AgCl). The control potential is regarded as an excitation signal. The excitation signal of a CV is a linear potential scan in a triangular waveform (see Fig. 2-1).
The excitation signal of the triangular waveform potential changes the direction of the sweep at a point called the switching potential. The excitation signal in Figure 2-1 scans from 0.00 V to -1.00 V in the negative direction with respect to the reference electrode, and then reverses and scans back to the original 0.00 V in the positive direction.
The scan rate, expressed as a gradient, is 20 mV / sec, and the second scan is indicated by the dotted line. The measurement parameters is setting through the software, according to the electrochemical analyzer used.
The cyclic voltamogram is expressed as a current-voltage curve. The current is considered as the response signal to the potential excitation signal. The current-voltage axis is shown in Figure 2-2. Since the potential is proportional to time, the horizontal axis can be regarded as the time axis. This helps to understand the basics of the CV technique. The oxidation and reduction intensities of the electrode are controlled by the applied voltage.

Fig. 2-1 Typical excitation signal of CV.

Fig. 2-2 Current-voltage curve of CV.
A potential scan in the negative direction makes the electrode a strong reducing agent. On the other hand, a positive potential scan makes the electrode a strong oxidizer. Figure 2-3 shows a typical cyclic voltammogram. Tin oxide film was used as the working electrode, 0.5 mM Methyl viologen di-cation (MV-2+) was used as the sample, and 0.1 M pH 7.0 phosphate buffer was used as the supporting electrolyte.
The excitation signal used is shown in Fig. 2-1, with a switching potential of -0.92 V. The initial potential is set to 0.00 V.

No electrolysis of MV2+ occurs at this potential. If the potential is made sufficiently negative to reduce MV, a reduction current flows through the electrode process as shown in equation above. The reduction current increases as it progresses from b to d. At d, the MV2+ concentration at the electrode surface is zero (peak d).
Since MV2+ is insufficient on the electrode surface due to reduction to MV+, the reduction current decays with a dependence of t-1/2 because MV2+ is insufficient at the electrode surface due to reduction to MV+. At -0.92 V, the scan direction is reversed and scanned in the positive direction. The MV+ that had been generated near the electrode is now oxidized (next equation), and the oxidation current flows. The oxidation current increases as we move from g to j, and at j, the MV+ concentration at the electrode surface becomes zero (peak j).
The first scan ends when the potential reaches zero. From this voltammogram, the anodic current (ipa), cathodic current (ipc), anodic peak potential (Epa), and cathodic peak potential (Epc) can be obtained. When using electrochemical analyzer, electrochemically important parameters are displayed on the monitor. In the case of an analog measuring device, it is calculated from the voltammogram shown in Fig. 2-3. The standard redox potential is E0 = (Epa + Epc)/2. The difference in peak potentials is (ΔEp = Epa - Epc = 58/n)mV (n: number of electrons transferred per mole molecule).

Fig. 2-3 Cyclic voltammogram of 0.5 mM Methyl viologen.
(Scan rate 20 mV/sec, electrode surface area 0.6 cm)
In cyclic voltammetry, a reversible process, the peak current is expressed by the Randles-Sevcik equation.
According to this equation, ip is proportional to the concentration C and proportional to the scan speed v1/2. there are a number of parameters that affect the CV curve. There are many parameters that affect the CV curve. For slow electron transfer reactions it increases &DeltaEp. The electron transfer reaction rate constant can be calculated by examining ΔEp and the scan rate. Note that the uncompensated resistance between the working and reference electrodes increases ΔEp. The effect of uncompensated resistance can be reduced by performing iR compensation.
2-3 About the device
Cyclic voltammetry (CV) is an electrochemical measurement technique that requires a potentiostat, an electrochemical measurement cell, and a PC for control and analysis.
The basic type of potentiostat used for electrochemical measurements is the three-pole type. The potentiostat applies an arbitrary potential between the working and reference electrodes. The working electrode causes the electrolysis of the sample of interest to occur on the electrode. The current required to maintain electrolysis at the working electrode is provided by the counter electrode. In the three-electrode method using a potentiostat, the current is prevented from flowing to the reference electrode.

Fig. 2-4 Electrochemical measurement system Model 2325 Bi-Potentiostat.
2-4 Electrochemical measurement cell
The following is a list of basic items needed to perform electrochemical measurements.
- Cell & cap
Prepare a glass cell to hold the sample and a cap to hold the electrode.
In addition, nitrogen gas must be bubbled to remove dissolved oxygen in the sample to maintain an oxygen-free state.
- Reference electrode
Prepare a reference electrode that matches the solvent. A saturated calomel electrode (SCE) or Ag/AgCl electrode is typically used.
In addition, select for organic solvents or alkaline solutions, if required.
Use a salt bridge for the reference electrode to prevent contamination between the reference electrode and the sample.
- Counter electrode
A platinum wire is used as the counter electrode, and it is directly immersed in the sample. Since the peak current is temperature dependent, it is better to use a thermostat or similar device to keep the sample temperature constant.
- Working electrode
Many materials are used for the working electrode, but when investigating the reduction region, the mercury electrode is the best electrode.
Platinum, gold, glassy carbon, graphite, carbon paste, etc. are commonly used as solid electrodes. These electrodes have good properties in the oxidation region.
There is also a voltammetry that uses a dropping mercury electrode (DME) and is called polarography. This electrode continuously drops mercury droplets from the tip of the glass capillary. Hanging mercury drop electrodes (HMDE) are widely used for CV measurements.
A thin layer of mercury is attached to a substrate electrode such as graphite to make a mercury film electrode. Mercury film electrodes are more convenient to use than DME.
Chemically modified electrodes and biosensors are also being studied using CV.
2-5 Conclusion
Cyclic volmethanemetry (CV) measurement, one of the electrochemical measurement techniques, is a popular measuring method for investigating redox states in all fields of chemistry. It can scan a wide potential range to determine the oxidized and reduced species of the sample. This, combined with the ability to vary the time scale and high sensitivity, makes CV measurements the most versatile electrochemical method. However, it is important to note that its features remain within the framework of qualitative or diagnostic use.
For quantitative measurements, as reaction rate and concentration measurements, other methods, such as, potential step method, pulse method, etc., are more suitable. In CV measurement, the reaction rate is often dominated, and care must be taken when determining thermodynamic parameters such as standard redox potential.
2-6 CV measurement
Measurement example of cyclic voltammetry (CV) measurement, which is one of the electrochemical measurement technique.
- Preparation of sample solution: 2 mM K3Fe(CN)6 solution (containing 1 M KNO3 as supporting electrolyte)
1. Add 16.5 mg potassium ferricyanide (special grade) to the beaker.
2. Add 2.53 g potassium nitrate to the same beaker.
3. Add ion-exchange water to dissolve, and transfer to a 25 mL flask for scale-up.
- Electrodes used
1. AUE Gold electrode OD:6mm ID:1.6mm (Cat. No.002014)
2. RE-1B Reference electrode (Ag/AgCl) (Cat. No.012167)
3. Platinum counter electrode 23cm (Cat. No.012961)
- Equipments used
1. CHI600E Potentiostat/Galvanostat
2. CS-3A Cell Stand Ver.1.1 (Cat. No.012779)
- Measurement parameters
The parameters are as follows, changing only the scan speed to 0.5, 0.25, 0.1, 0.05, and 0.25 for the measurement.
Monitor and display the potential-current data points on the screen.

Fig. 2-5 Measurement parameters.
Cyclic Voltamogram example using ALS Model 600D Electrochemical Analyzer.
.")
Fig. 2-6 Example of cyclic voltammogram by ALS model 600D electrochemical analyzer (overlay display).

Fig. 2-7 Dependence of peak current value on scan speed.
In the case of a diffusion-dominated reversible process, according to5) ip = 2.69x10⁵n3/2AD1/2Cv1/2, the peak current value is proportional to the square root of the scan speed, as shown in Fig. 2-7. From the slope of this line, the diffusion coefficient and other parameters can also be obtained.
Reference:
1) Bard,A.J. and Faulkner,L,R.,Elecrochemical Methods (wiley,New York,1980).
2) Kissinger,P.T. and Heineman.W.R., Ends.,Laboratory Techniques in Electroanalytical Chemistry (Marcel Dekker, New York, 1984.
3) Howell.J., Currnet Separations,Vol.8(1987)2.
4) Kissinger,P.T.,Currnet Separations,Vol.6(1985)65.
5) R.S. Nicholson, I.Shain, Anal.Chem.,36,706(1964).
Section 3: Electrode for cyclic voltammetry (CV)
Working electrodes used as electrodes for electrochemical measurements such as cyclic voltammetry (CV).
3-0-1 Handling of electrodes for CV

Fig. 3-1 Potential window in an aqueous solution.
As working electrodes for electrochemical measurements, we have a lineup of several dozen types of electrodes made of the materials shown in the table above.
These working electrodes are compact and easy to handle, and the user can easily polish and regenerate the electrode surface.
When you receive the electrode, It is recommended to remove the cap covering the electrode and check the electrode surface.
The carbon paste electrode is not filled with carbon paste (sold separately).
The surface of the electrodes has been carefully pre-polished, so it can be used immediately.
The electrode material part of the working electrode is fixed in PEEK※1 resin.
PEEK resin is hard and has excellent chemical resistance※2.
However, due to its structure, excessive ultrasonic cleaning operation may cause deformation.
※1 PEEK: Polyether ether ketone
※2 High concentrated sulfuric acid will degrade the product. Do not use THF (Tetrahydrofuran) solution for a long time. Also, avoid high temperatures that exceed the temperature coefficient of the resin and electrode materials.
3-0-2 CV (Cyclic Voltammetry) Measurement
Linear Sweep Voltammetry (LSV), an electrochemical measurement method, samples the current response at a constant scan rate between the initial and final potentials.
Cyclic voltammetry (CV), on the other hand, is a method of measurement in which, after reaching at the final potential in LSV, the scan direction is reversed and scanned again toward the initial potential, and repeated as necessary. CV measurements are widely used because the electrochemical reactants produced in the forward scan can be studied in the reverse scan direction.
CV potential application and current response

Fig. 3-2 Typical reversible voltammogram.
David K.Gosser,Jr.,Cyclic Voltammetry Reaction Mechanisms,VCH Publishers. Inc, 1994.
When the potential of the triangular wave as shown in the upper left graph is applied from the potentiostat to the electrochemical cell, the current response as shown in the upper right graph can be obtained.
What you can see from the CV waveform
The CV waveform tells us the following about the material.
- Stability of oxidized and reduced species
- Absorption of oxidized and reduced species
- Reaction rate constant
- Reaction mechanism
- Electrochemically reversible or irreversible
- Standard redox potential E0 = (Epa + Epc)/2
- Number of electron transfers (ΔEp = Epa - Epc = 58/n)
n:Number of electron transfers per molecule
3-0-3 CV measurement using microelectrodes
Microelectrodes with a small electrode surface area are also available as working electrodes for electrochemical measurements.

Fig. 3-3 Distribution of sample concentration with respect to the
disk electrode surface under steady-state current conditions.
A: Disk electrode, B: Insulator, r: Distance
- Increased current density due to more efficient transport of redox species
- Steady response can be obtained
- Fast sweeping is possible
- Accurate measurement of redox potential
- Reaction analysis of short-lived electrode reaction intermediates
- Measurement can be performed even with samples having low support salt concentrations
- Edge effect can be ignored
- Can be used with organic solvents with small dielectric constant
3-0-4 Selection of working electrode
- Potential scanning is in the range of mV to V/sec
- Potential window is used in a limited area
- Measured currents in the nA to µA level
- Chemically stable and does not form a complex with other ions

Fig. 3-4 Changes in voltammogram due to scan rate.
3-0-5 PFCE graphite carbon electrode and other types of working electrodes
The working electrode for electrochemical measurements, Plastic Formed Carbon electrode, is made of PFC (Plastic Formed Carbon), which is a composite material of graphite and carbon, and was developed through joint research between Mitsubishi Pencil Corporation and the National Institute of Advanced Industrial Science and Technology. The characteristics of this electrode are similar to those of HOPG. As shown in the figure below, the graphite edge surface of the reaction site is highly oriented and exposed on the electrode surface.
PFCE electrodes are insulated with furan-based resin. Furan resin has high mechanical strength and excellent chemical resistance, heat resistance, and abrasion resistance (see Table 3-1).

Fig. 3-5 Comparison between PFCE graphite carbon electrode and HOPG.
Table 3-1. Solvent resistance of furan resin.
| Solvent type | Aromatic | Chlorine-based substances | Ketones | Aldehyde | Ethers | Amines | Aliphatics | Organic acid |
| Furan | good | good | good | good | good | good | good | good |
| Types of Electrodes Applications | Applications |
| Platinum electrode | General electrode, with hydrogen absorption wave, measurement of hydrogen peroxide and oxidants |
| Gold electrode | General electrode, no hydrogen absorption wave, measurement of thiol compounds |
| Glassy carbon electrode | Chemically stable electrode with high overvoltage for hydrogen and oxygen generation |
| Silver electrode | Measurement of cyanide and sulfide compounds |
| Carbon paste | Used as a modified electrode by mixing enzymes or chemicals with the electrode |
| Nickel electrode | Used to measure amino acids by chemical modification |
| Palladium electrode | Study of hydrogen adsorption and desorption processes |
3-0-6 CV electrode shape
We offer a wide range of working electrodes for electrochemical measurements.
In addition to electrode materials, there are several types of shapes available.

Fig. 3-6 Working Electrode size
Standard type: Standard electrodes can be used in SVC-2, SVC-3, VC-4 voltammetric cells
L type: PEEK long type with 110 mm length
S type: 3 mm outer diameter, used when measuring a small amount of sample
Microelectrode: High-speed sweep is possible. Can be used to determine diffusion coefficient
Mesh electrode: Bulk electrolysis etc. It can also be used as a counter electrode
※ There is also a thick type with an outer diameter of 10 mm.
※ The length is for reference only.
3-1 CV Electrodes & Accessories
We have a wide range of electrochemical working electrodes for electrochemical measurements, and we also offer custom-made electrodes.
- Custom-made electrodes are also available, so please feel free to contact us.
- Before use, please read the precautions in the instruction manual attached to the product.
- The working electrode is designed to be used at normal temperature and pressure.
3-2 Thin-layer electrochemical flow cell type electrode
The thin-layer flow cell for electrochemical measurement and the dedicated electrode can be used for research such as flow analysis using electrochemical.
The working electrode materials such as platinum, gold, silver, carbon paste, and nickel are also used for other specialized analyzes.
Features
- Stable in a short time
- Standard electrode is dual type (cross flow cell)
- Can be used under acid, alkali and organic solvent conditions
- Application by parallel/series arrangement of electrodes
- Can also be used as a single electrode
- The working electrode can be regenerated by polishing with PK-3 polishing kit
- Can be used as a chemically modified electrode/biosensor
- PEEK resin with excellent chemical resistance is used for the block part where the electrodes are embedded
Cross flow cell structure

Fig. 3-7 Cross Flow Cell Kit
Structure of the working electrode
For the dual electrode, the electrode surface area doubles by using the jumper connector, and high sensitivity analysis becomes possible. For the working electrode, the platinum/gold electrode and others are also available.

Fig. 3-8 Structure of the working electrode.
Radial flow cell structure
The wall jet of the sample, after hit in to the surface of the electrode, spreads in three dimensions. After hitting the sample on a thin layer electrode directly, it flows to the perimeter from the center of the radiated electrode, improving the sensitivity.

Fig. 3-9 Radial Flow Cell Kit
Principle of dual electrode

Fig. 3-10 Structure of electrodes used in electrochemical detectors.

Fig. 3-11 Comparison of the principle of UV monitor and ECD.
• Analysis conditions
• Sample: rat brain tissue
• Mobile phase
∘ Monochrome acetic acid
∘ Contains THF, Na2EDTA, SOS
• Column: Biophase ODS-4 4.0x110 mm
• Potential:700mV,800mV
• Range: 10nAF.S.

Fig. 3-12 Chromatogram of brain tissue sample analyzed using parallel electrodes.

Fig. 3-13 Comparison between fluorometer and electrochemical detector.

Fig. 3-14 Chromatogram of biogenic amines analyzed using dual electrodes in series.
The chromatograms of the seven components, consisting of norepinephrine, epinephrine, dopamine, Dopac, serotonin, 5-HIAA and HVA, were analyzed by LCEC with electrodes in series.
3-3 Monitoring of reduced substances
Liquid chromatography with electrochemical detection (LCEC) measurement has made significant progress mainly in the measurement of substances that can be oxidized electrochemically (neurotransmitters such as catecholamines and indoleamines). In comparison, its application to reducing substances has been slower.
The reason is that the presence of 10-3 〜 10-4 M in the mobile phase and the dissolved oxygen contained in the sample under atmospheric pressure poses a problem for analysis under negative potential.
[1] Electrochemical reaction of oxygen
Oxygen is easily reduced by the electrodes to form H2O2 or H2O. According to Fig. 3-10 and 3-11, the negative potential that can be applied is limited to a very narrow range where the reduction current of oxygen does not become excessive. That is, the mobile phase and the dissolved oxygen in the sample affect the analysis.

Fig. 3-15 Oxygen voltammogram for glassy carbon and amalgam electrodes.

Fig. 3-16 Reduction potential range depending on the electrode material.
A: Reduction potential range of normal mobile phase
B: Reduction potential range after dissolved oxygen
[2] Dissolved oxygen problem in mobile phase
When performing microanalysis by LCEC, dissolved oxygen contained in the mobile phase reacts on the electrode surface to generate a high residual current, which prevents the analysis from being performed. As shown in Fig. 3-12, the generation of residual current can be suppressed by effectively deoxidizing the mobile phase.

Fig. 3-17 Dissolved oxygen removal system in the mobile phase and sample.
[3] Problems with dissolved oxygen in the sample
The problems caused by the oxygen present in the sample are as follows.
- 1. Retention time is not constant
- 2. Peak becomes broad and tailing also occurs
- Since 1 and 2 are the effects of oxygen, it is necessary to remove oxygen in the sample. The removal method is to remove oxygen by purging the inert gas (N2 gas) before injecting the sample. It is important to carefully control the flow rate and purge time of the inert gas to determine the amount of injection with good reproducibility. There are two problems with this system:
- 1. Not suitable for samples containing volatile substances
- 2. Limited injection volume
[4] Oxygen removal by dual electrodes
Oxygen can be removed from the sample by using the electrodes in series. Oxygen in the sample reacts electrochemically to generate H2O2 or H2O. This is an irreversible reaction. The sample also undergoes a reversible redox reaction. By applying a negative potential to the W1 electrode shown in Fig. 3-18 to reduce oxygen and cause the oxidation reaction at the W2 electrode, the interference of oxygen to the W2 electrode can be effectively eliminated. Therefore, the removal of oxygen from the sample is no longer necessary. The applicable range of analysis by reduction reaction is substances that can be reversibly redoxed. Fig. 3-19 shows a chromatogram obtained by analysis using the redox reaction.

Fig. 3-17 Dissolved oxygen removal system in the mobile phase and sample.

Fig. 3-19 Chromatogram of redox substances by dual series electrode.
- Analysis conditions
- Sample
- 1:1,4-Dimethyl aminophenyl-azobenzene-4-sulfonic acid(56.4pmol)
- 2:3,5-dinitrotoluene(46.8pmol)
- 3:3,4nitrotoluene
- Mobile phase 0.1M sodium acetate, pH 5.0, n-propanol
- Column: Biophase Octyl 5µm, 4.6x250 mm
- Electric potential -850 mV, +450 mV (Glassy Carbon)
- Flow rate 1.1 ml/min
- Range 5 nA/FS
3-4 Lithography electrode
[1] Lithography electrode: Features of Interdigitated Array (IDA) electrode
The electrochemical detection method is usually used to quantify a substance by measuring the electric current generated when an electrode is immersed in a solution and an electric potential is applied, and the substance of interest transfers electrons to and from the electrode (redox reaction).
In general, this reaction consists of a process in which a substance diffuses onto the electrode, transfers electrons to and from the electrode, and then diffuses into the solution. As the area of the electrode is reduced, the diffusion state of the substance to the electrode changes from linear to (semi-)spherical or (semi-)cylindrical depending on the electrode shape, and the amount of substance arriving per unit time and unit area increases. As a result, the current density increases and the signal-to-noise ratio improves. In addition, because the electrode area is small, the charging current to the electric double layer at the electrode interface is small, enabling a fast response.
Interdigitated Array Electrode (IDA, Fig. 3-15) is a counter electrode consisting of two interdigitated microband array electrodes in the shape of comb teeth. By setting one end of the IDA to the oxidation potential of the substance to be measured and the other end to the reduction potential, the redox of the substance can be repeated very efficiently between the two electrodes.
This redox cycle allows for an apparent increase in current value.

Fig. 3-20 Structure of IDA electrode.
Fig. 3-16 shows the cyclic voltamogram of ferrocene when only one or both of the IDA electrodes are connected to the potentiostat. The cyclic voltamogram (single mode) when the potential is applied to only one of the IDA electrodes shows the same behavior as that of a square electrode.
In contrast, if one electrode (generator) is swept while the other electrode (collector) is held at the reduced potential of ferrocene (dual mode), a redox cycle occurs when the generator potential reaches the oxidation potential of ferrocene. The redox cycle occurs when the potential of the generator reaches the oxidation potential of ferrocene, that is, the oxidation current of ferrocene is observed on the generator side, and the reduction current of ferrocenium ions diffused on the collector side. The reduced ferrocene diffuses back into the generator, and the oxidation and reduction cycles are repeated.
The ratio of the oxidation current to the reduction current observed at this time is defined as the capture ratio, and the smaller the electrode width and spacing, the higher the capture ratio. However, when the electrode size reaches the micron order, the capture rate becomes almost 100% and saturates. The oxidation current in single mode depends on the sweep speed, but when the sweep speed is less than a few mV/min, the response is almost steady.

Fig. 3-21 Comparison between single mode and dual mode using IDA electrode.
The ratio of the oxidation current at this time to the oxidation current in the dual mode is called the redox cycle number, and it increases as the electrode width and spacing become smaller.
In the case of an IDA electrode, a concentration gradient of oxidized and reduced substances is immediately formed between adjacent electrodes, so the time required to reach a steady state is short, and a large amplified sigmoidal waveform with small hysteresis is obtained. The steady-state current is determined by the shape of the electrode and the concentration and diffusion coefficient of the substance being measured, and its magnitude is determined analytically, usually using the following approximate equation.
Where: I is the current, m is the number of IDA electrode, b is the length of the IDA electrode, F is Faraday's constant, C∗ is the concentration, D is the diffusion coefficient, w is the sum of the electrode width and the electrode spacing, and g is the electrode spacing. In the dual mode, a sigmoidal waveform is obtained at both the generator and the collector, but at low concentration samples, the generator is affected by the charging current associated with the potential sweep, and the sigmoidal shape collapses, making it difficult to analyze the sample. On the other hand, since the potential is fixed on the collector side, there is no contribution from the charging current, so the waveform does not collapse easily even with low concentration samples, and a detection limit of 10&sup(-8)+mol/l can be obtained.
[2] Electrode material
For electrodes fabricated using lithography, metals are generally used due to limitations in thin-film formation technology and mask materials for etching, and platinum and gold are typical electrode materials.
Indeed, these precious metals are stable in a wide potential range and can carry out the desired electrochemical reaction without interference from the dissolution reaction of the electrode itself, and have been used as electrode materials in ordinary electrochemical analysis. Carbon microelectrodes with a wider potential window than platinum or gold have been desired, but due to the difficulty of microfabrication, even when used as microelectrodes, the mainstream method has been to bundle carbon fibers and polish the end faces to use them as electrodes, a method that does not allow control of the electrode shape. However, with the development of microfabrication technology for carbon thin films, carbon microarray electrodes have been realized5).
Fig. 3-17 shows the baselines for the platinum, gold, and carbon IDA electrodes. Even though the solution does not contain any redox substances, the residual current flows at the platinum and gold IDA electrodes as the range of the instrument is expanded. In contrast, the carbon IDA electrode has a small residual current, and a very flat baseline can be obtained, especially with a fixed potential electrode, indicating that it is suitable for detecting low concentration solutions.
Carbon microelectrodes are characterized by a wide potential window, easy electrochemical activation, easy surface modification, and other excellent electrochemical properties.

Fig. 3-22 Voltammogram of platinum, gold, and carbon IDA electrodes in pH 7 PBS.
[3] Application as a liquid chromatography detector
Since a sample usually contains a mixture of several substances, it is necessary to separate them and quantify them. For this separation, liquid chromatography is used, and the use of IDA electrodes as detectors is being considered. In particular, conventional liquid chromatography requires a large amount of sample due to the large capacity of the separation column, which is a major problem when only a small amount of sample can be obtained, such as in experiments on biological systems.
To solve this problem, it is effective to use a microcolumn with a small volume, but the sensitivity of the detector decreases as the flow rate decreases, so using a microcolumn that can only flow at a low speed results in a decrease in detection sensitivity. However, the use of a IDA electrode allows the redox reaction to be repeated, thus reducing the effect of a decrease in flow rate and enabling detection with high sensitivity.

Fig. 3-13 Velocity dependence of an IDA electrode in single and dual modes by FIA analysis.
Fig. 3-18 shows the dependence of the current on the flow velocity when using an IDA electrode in single and dual modes in flow injection analysis. In the single mode, the current decreases in proportion to the 1/3 power of the flow velocity, whereas in the dual mode, the current value approaches the limiting current in cyclic voltammetry as the flow velocity decreases. Although it is difficult to measure at flow rates higher than 0.1 ml/min when using a microcolumn, the IDA electrode is very effective for measurements at low flow rates. In particular, since the residual current of the carbon IDA electrode is small, as mentioned above, it has less noise even in the pA range, enabling measurement with higher sensitivity than other precious metal electrodes. The combination of liquid chromatography using this microcolumn and the carbon IDA electrode enables ultra-sensitive measurement of neurotransmitters in living organisms with extremely small amounts of secretion, requiring only 5 µl of sample for measurement, which is a drop of the tip of a syringe needle7‚ 8).
Fig. 3-19 compares the results of liquid chromatography using IDA electrodes as detectors for sample solutions of the neurotransmitters DOPAC and dopamine (DA) with those obtained with conventional electrodes. It can be seen that the substances are well separated and the noise is extremely low. Dopamine can be detected with 5fg, which is 1/100 of the conventional detection limit, that is, 5 grams per 1000 trillion.
 using an IDA electrode.")
Fig. 3-24 Detection of DOPAC and dopamine (DA) using an IDA electrode.
[4] Future prospects
In principle, the concentration of the target substance does not decrease with measurement because of the redox cycle at the IDA electrode. In addition, the concentration distribution in the direction perpendicular to the electrode surface of a IDA electrode is almost always determined within the distance between the centers of adjacent IDA electrodes. For these reasons, the target material is not consumed even if the IDA electrode is incorporated into a thin layer cell and electrolyzed for a long time. In addition, a new stripping method called "conversion stripping"9), which combines an IDA electrode with a conventional electrode, has made it possible to detect reversible substances with ultra-high sensitivity of 10 pM. The use of a carbon IDA electrode is also a very effective method for various electrochemical measurements because it reduces the residual current.
As for liquid chromatography detectors, the cross flow type used in this study (eluent flows across the surface of an IDA electrode), and the radial flow type, in which eluent is introduced from above into the center of the electrode in a thin layer cell and flows in concentric circles along the electrode, are attracting attention for their ability to perform more sensitive measurements. In this type of detector, the eluent is introduced into the center of the electrode from above and flows in concentric circles along the electrode10). In this type of detector, the injected sample reacts 100%, and the entire surface of the electrode is not effectively utilized. On the other hand, if concentric mulching electrodes are used, the sample molecules are regenerated by the redox cycle, preventing 100% consumption of the sample, which is expected to be developed in the future.
[5] References
1) K. Aoki, Electrochemistry and Industrial Physical Chemistry, 56, 608 (1988).
2) K. Aoki, M. Morita, O. Niwa, H. Tabei, J. Electroanal. Chem., 256, 269 (1988).
3) O. Niwa, M. Morita, H. Tabei, Anal. Chem., 62, 447 (1990).
4) O. Niwa, M. Morita, H. Tabei, Electroanalysis, 3, 163 (1991).
5)H. Tabei, M. Morira, O. Niwa, T. Horiuchi, J. Electroanal. Chem., 334, 25 (1992).
6) M. Takahashi, M. Morita, O. Niwa, H. Tabei, J. Electroanal. Chem., 335, 253 (1992).
7) H. Tabei, M. Takahashi, S. Hoshino, O. Niwa, T. Horiuchi, Anal. Chem., 66, 3500 (1994).
8) O. Niwa, H. Tabei, B.P. Solomon, F. Xie, P.T. Kissinger, J. Chromatography B, 670, 21 (1995).
9) EC Technique Guide, BAS, p48, 53.
10) C.E. Bohs, M.C. Linhares, P.T. Kissinger, Current Separations, 12(4), 181(1994).
3-5 IDA electrode
Interdigitated Array (IDA) electrode is an electrode developed for electrochemical measurements to be performed in a very small quantity of the sample. IDA electrode could be applied for the detection and reaction analysis of the compounds in a small quantity of the sample. IDA electrode is a microelectrode pattern fabricated by using the lithography technology. The Electrodes are composed of 65 pairs. In each one of the pair has a function of the oxidation and reduction electrodes.

Fig. 3-25 Structure of IDA electrode.
● Features
- High sensitivity CV measurement
- Very small sample quantity for EC measurement
- Small and integrated
- Fast response
- Conductivity measurement
● Application example
- HPLC measurement electrode
- Electrochemical measurement electrode
- Bio-sensor and chemical sensor electrode
- Chemically modified electrode
- Chemical reaction parameter monitoring electrode
[1] Electrochemical measurement with IDA electrode
The IDA electrode is very useful for electrochemical measurements of trace substances. The working, reference, and counter electrodes are formed as a single unit, and are dropped onto the electrode so that each electrode is connected with the sample solution. (The reference electrode should be plated with silver/silver chloride comb.) Since the sample is only a few µL, it may evaporate, so a cover glass (5×5 mm) is placed on the sample to prevent evaporation while performing the CV measurement.

Fig. 3-26 Sample preparation for electrochemical measurement using IDA electrode.
The potentiostat is then connected to the electrode with the sample on it. If the sample is a redox substance, set one of the working electrodes to a constant potential and scan the other electrode, and the cyclic reaction of the sample will occur electrochemically, enabling high-sensitivity analysis.
Fig.3-27 Cycling reaction using IDA electrode.
[2] How to use the reference electrode part of the IDA electrode
When using the reference electrode part of the IDA electrode, it is necessary to perform silver/silver chloride plating. This section describes how to make a reference electrode for an IDA electrode.
Example: What to prepare:
• IDA electrode Au or IDA electrode Pt
• Ag/AgCl Ink for reference electrode (2.0mL)
Silver/silver chloride ink is made of thick silver/silver chloride porous polymer. Therefore, it can be used as a silver/silver chloride electrode regardless of the electrode material by applying the ink to the metal part that will be the reference electrode.

Fig. 3-28 How to make an IDA electrode.
Stir the silver/silver chloride ink before use. 5µl of ink is taken and applied to the reference electrode. At this time, do not apply ink to the reference electrode portion that covers the insulating film. Apply the ink to the entire area that will be the reference electrode in the measurement window (see Figure 2).
Apply the ink to the reference electrode and allow the electrode to dry thoroughly.
Lightly rinse the electrode surface with distilled water and wipe off any water droplets.
After the above process, the reference electrode can be used as a silver/silver chloride electrode.

Fig. 3-29 Ag/AgCl Ink is applied to the reference electrode site.
[3] About cleaning
※ This is a disposable type product. We do not recommend reuse of IDA electrodes.
After using the IDA electrode, it may be possible to remove some dirt by rinsing it with ethanol and then rinsing it thoroughly with pure water.

Fig. 3-30 Damaged comb electrode.
Basically, we do not recommend repeated use of IDA electrode. If ultrasonic cleaning is performed for a long time or repeatedly because of heavy contamination, the insulating film and electrodes may peel off from the substrate of the comb electrode. If the insulating film is peeled off from the substrate and the working electrode and counter electrode are peeled off, the electrode will not function.
Please note that the insulating film and electrodes may peel off if the following operations are performed.
- When cleaning with ultrasonic cleaner for a long time or repeatedly
- When cleaning with ozone cleaner for a long time
- When the electrode surface is polished by physical means such as cotton swabs
- When the flow cell electrode and the comb electrode are set using a thin film gasket and come into contact with the counter electrode
- When immersed in an organic solvent such as acetone for a long time
In particular, carbon and gold electrodes have the property of being easier to peel off from the glass substrate than platinum.
[4] About pin connection
- For IDA electrode
Since the IDA electrode is formed on the surface of the glass, connect the electrode terminals using a dedicated cable and Teflon plate.
1. Place the IDA electrode on the Teflon plate.
2. Insert the above electrode combination into the socket of the dedicated cable.
3. Fix the cable to the mini-vice.

Fig. 3-31 Teflon plate with IDA electrode.

Fig. 3-32 Fixing the IDA electrode combination to the mini-vice.

Fig. 3-33 Cable connection method:
Red: reference electrode, white: W2 working electrode,
green: counter electrode, black: W1 working electrode.
- For ring-disk electrode
The FPC is fixed to one end of the film electrode, and the connector is fixed to the FPC with solder. The connector is attached as shown in the figure below, so use a small alligator clip to connect it. Then, connect the potentiostat to the cable for measurement.

Fig. 3-34 Ring-disk electrode connection method.
[5] Precautions for handling IDA electrode
Ideally, the counter electrode area of the IDA electrode should be larger than the working electrode. There is no problem if the large area (counter electrode in the figure) is used as the reference electrode. However, if a sample with high concentration is used in single mode, an overcurrent may flow to the counter electrode, which may affect the measurement. Please pay attention to the wiring between the reference electrode and the counter electrode.
When using Silver/silver chloride ink for reference electrode, care must be taken because the area of the reference electrode is small. However, when the IDA electrode is used by immersing it in the sample, silver/silver chloride ink may be applied to the counter electrode, which is easy to handle, if a counter electrode is prepared separately.
When measuring by dropping the sample on the analysis window, be sure to apply silver chloride ink to the reference electrode and do not make a mistake in the wiring.
3-6 Ring-Disk electrode
The ring disk electrode developed by NTT Atsugi Research and Development Center is a ring disk type electrode formed on a glass substrate as shown in the figure below. In electrochemical measurements, it is used as a radial flow cell electrode, and coulometric electrolysis efficiency can be obtained by micro-feeding.
At this time, 100% of the oxidation reaction (reduction reaction) can be carried out at the central disk electrode, which is characterized by the ability to identify and quantify substances at once, and the ability to analyze subsequent chemical reactions. By immobilizing osmium gel/HRP (Horse Radish peroxidase) developed by Prof. Adam Heller of the University of Texas on this electrode, hydrogen peroxide can be measured at 0 V. In combination with various oxidizing enzymes, a flow injection analysis system can be constructed.
Example: Using a ring disk electrode as a flow cell electrode
Fig. 3-34 Structure of ring disk electrode.

Fig. 3-35 Fixing the electrode to the radial flow cell.
Electrode types: carbon, gold, platinum
Disk electrode diameter: 3 m
Ring electrode outer/inner diameter: 6 mm/4 mm
Electrode thickness: about 0.05 to 0.15 µm
[1] Examples of amperometric applications with Ring-Disk electrode
The Ring-Disk electrode is very useful for measuring trace substances as an HPLC detection electrode. It is also effective for application to flow cell type sensors. As for the Ring-Disk electrode, the disk part is placed inside and the ring part is placed outside as a working electrode.
In order to place the Ring-Disk electrode into the flow cell:
- Place the silicone gasket under the Ring-Disk electrode.
- Place the Teflon gasket on the Ring-Disk electrode.
- Then place the Ring-Disk electrode in the radial flow cell.
※At this time, keep the electrode parallel to the counter electrode and turn the clamp by hand to fix it. If the gasket is a thin Teflon gasket, the Ring-Disk electrode and the counter electrode will come in contact with each other, and the electrode will peel off from the glass substrate, so be careful.
When used as a flow cell, the liquid must pass through, but if it is in contact, the liquid will not flow easily or will be blocked.
⟨ How to use the Ring-Disk electrode ⟩
- Attach the silicon plate to the back of the Ring-Disk electrode. ※At this time, align the circle of the silicon plate with the disk of the electrode.
- Attach the gasket to the counter electrode.
- With the ring disk electrode surface facing the counter electrode, attach it as shown on the Fig. 3-35, and fix it with a clamp.
- Apply the desired potential to the ring and disk electrodes using the LC-4C amperometric detector.
[2] Measurement of glutamate with Ring-Disk electrode
Niwa et al.1) report a technology for directly monitoring a sample obtained by microdialysis, etc. by immobilizing an enzyme on a ring disk electrode. In particular, we are conducting real-time measurement of glutamic acid, one of the neurotransmitters that is in the limelight in neuroscience.
Glutamate is said to be involved in memory (long-term potentiation) in the hippocampus in the brain.
As a method:
- On-line sensor using radial flow cell and enzyme column.
- Measurement of glutamate release in response to stimuli in a cultured cell system combined with a sampling probe such as a microdialysis membrane.
- Glassy carbon electrodes of 3 mm or 6 mm diameter and ring disk thin film carbon electrodes were used as electrodes.
- The enzyme (glutamate oxidase, Yamasa Soy Sauce: GluOx) was immobilized on beads and packed in a peak tube.
- A polyvinylpyridine-Os complex (Os-gel-HRP) containing horseradish peroxidase (HRP) was modified on the electrode as a mediator (1).
A schematic diagram of the detection is shown in Fig. 3-36.
- Glutamate is oxidized by enzymes, and the generated hydrogen peroxide is reduced by HRP.
- The HRP oxidized by the reaction is returned to the reduced body by supplying electrons from the electrode via the Os polymer.
- The glutamate concentration can be measured by continuously monitoring the magnitude of the reduction current from the electrodes.
The actual measurement was performed using two syringe pumps, one was a buffer solution and the other was a glutamate standard solution, and the sensitivity and detection limit of the sensor were evaluated.

Fig. 3-36 Schematic diagram of the reaction at the sensor.

Fig. 3-37 Schematic diagram of glutamate release measurement from cultured cells using a sensor.
As a measurement sample, cerebral cortical neurons of rat embryo were cultured on a substrate having a thin film electrode array.
As shown in Fig. 3-37, it was stimulated electrically or with KCl using a thin film electrode, glutamate near the cells was continuously sampled by a microdialysis probe, and the concentration change was measured by a sensor (see Fig. 3-38).

Fig. 3-38 Change in glutamate concentration in rat cultured extracellular fluid.
[3] Reference
1) O. Niwa, K. Torimitsu, M. Morita, P. G. Osborne and K. Yamamoto, Anal. Chem. 1996, vol 68, No11, p1865-1870.
3-7 Types of IDA electrodes and Ring-Disk electrode
IDA electrode
| Catalog No. | Description | Width (µm) | Interval (µm) | Length (mm) | Number of feet (pairs) | Film thickness |
| 012125 | IDA electrode (Au) | 10 | 5 | 2 | 65 | 90 nm∗ |
| 012126 | IDA electrode (Pt) | 10 | 5 | 2 | 65 | 90 nm∗ |
| 012127 | IDA electrode (Carbon) | 10 | 5 | 2 | 65 | 1.2 +/- 0.1 µm |
| 012128 | IDA electrode (ITO) | 10 | 5 | 2 | 65 | 100 +/- 20 nm |
| 012129 | IDA electrode (Au) | 3 | 3 | 2 | 65 | 90 nm∗ |
| 012130 | IDA electrode (Pt) | 3 | 3 | 2 | 65 | 90 nm∗ |
| 012257 | IDA electrode (Au) | 2 | 2 | 2 | 65 | 90 nm∗ |
| 012258 | IDA electrode (Pt) | 2 | 2 | 2 | 65 | 90 nm∗ |
| w/o passivation membrane | ||||||
| 012259 | IDA electrode (Au) without passivation membrane | 10 | 5 | 2.5 | 65 | 90 nm∗ |
| 012262 | IDA electrode (Pt) without passivation membrane | 10 | 5 | 2.5 | 65 | 90 nm∗ |
| 012266 | IDA electrode (Carbon) without passivation membrane | 10 | 5 | 2.5 | 65 | 1.2 +/- 0.1 µm |
| 012265 | IDA electrode (ITO) without passivation membrane | 10 | 5 | 2.5 | 65 | 100 +/- 20 nm |
| 012260 | IDA electrode (Au) without passivation membrane | 3 | 3 | 2.5 | 65 | 90 nm∗ |
| 012263 | IDA electrode (Pt) without passivation membrane | 3 | 3 | 2.5 | 65 | 90 nm∗ |
| 012261 | IDA electrode (Au) without passivation membrane | 2 | 2 | 2.5 | 65 | 90 nm∗ |
| 012264 | IDA electrode (Pt) without passivation membrane | 2 | 2 | 2.5 | 65 | 90 nm∗ |
◇◆◇ Click here for details ◇◆◇
Ring-Disk electrode
| Catalog No. | Description | Ring (mm) | Disk (mm) | |
| OD | ID | |||
| 002081 | Gold ring disk electrode (3 pcs) | 6 | 4 | 3 |
| 002082 | Platinum ring disk electrode (3 pcs) | |||
| 002083 | Carbon ring disk electrode (3 pcs) | |||
◇◆◇ Click here for details ◇◆◇
Section 4: Reference electrode
The set potential shifts due to changes in the composition of the solution filled the reference electrode. This is related to the movement of ions and solvent through the ion-permeable glass. The rate of the concentration change depends on the difference in composition between the sample solution and the filling solution. The used reference electrode should be stored in the specified solvent. This storage method will restore the salt concentration inside the reference electrode to its original state. Since the reference electrode is a consumable item, its lifetime depends on the condition of use or storage method.
For the check whether the reference electrode is normal or not, immerse the electrode to be checked and a new electrode in 3 M NaCl solution. Then measure the potential difference between the two electrodes with a voltmeter. If the two electrodes are of the same type (Ag/AgCl vs Ag/AgCl, calomel vs calomel), the result will be 0 ± 20 mV.
If the reference electrode is bad, the potential difference between the electrodes will show a large value. When checking different types of electrodes, for example, a calomel electrode will display a positive or negative value on the voltmeter and the voltmeter reading will be in the range of 60 ± 20 mV. Composite pH electrodes are not suitable for this test.
4-0-1 Checking method for aqueous reference electrodes
When checking whether the aqueous reference electrode for electrochemical measurement is normal, place the reference electrode to be checked and a new reference electrode of the same type in a single cell and check the potential difference.
Since the reference electrodes in this cell are the same, it is ideally 0 Volt, but in reality there is a slight potential difference.
At this time, the reference electrode is immersed in 3 M NaCl solution or saturated KCl solution, and the potential difference between the two reference electrodes is measured using a voltmeter.
Whether the potential difference between the electrodes exceeds 0 ± 20 mV, it will be an indication to replace the electrode with a new one.

Fig. 4-1 Checking the reference electrode.
| Product | Potential |
| NHE (Normal Hydrogen Electrode) | 0 mV |
| SCE (Saturated Calomel Electrode) | 241 mV |
| SSCE (Sodium Saturated Calomel Electrode) | 236 mV |
| Ag/AgCl (Saturated NaCl) | 201 mV |
| Ag/AgCl (Saturated KCl) | 198 mV |
| Hg/HgSO4 (Saturated HgSO4) | 616 mV |
| Cu/CuSO4(Saturated CuSO4) | 300 mV |
4-0-2 Reference electrode applications and uses
The reference electrode for electrochemical measurements is used as reference electrode for cyclic voltammetry and high performance liquid chromatography. The reference electrode is available in RE series and include a wide range of electrodes such as for aqueous samples (silver chloride), non-aqueous solvent samples, calomel type, reference electrode for use in alkaline solutions, reversible hydrogen electrode, etc.
4-0-3 Use of reference electrode
The tip of the silver/silver chloride reference electrode for electrochemical measurements you purchased is sealed with parafilm to prevent it from drying out before use. Carefully remove this parafilm when using the reference electrode. Then, lightly pinch the tip of the protective cap with your fingers and gently twist the electrodes to remove the protective cap.

Fig. 4-2 How to use the silver/silver chloride reference electrode.
The RE-3VT Reference electrode screw type (Ag/AgCl) is composed of polymethylpentene and ceramics. A connecting pin is embedded in the top cap. And 3 M NaCl solution is sealed inside the main body. If the reference electrode is not used, put 3 M NaCl in a beaker, cover it with parafilm, and make a hole of about 5 mm in it, with something other than the electrode, and pass the electrode through.
4-0-4 Use of non-aqueous solvent reference electrode
For electrochemical measurements, the sample holder dia 9 mm can be used as a double junction for the reference electrode.
The non-aqueous reference electrodes are immersed directly in the sample solution. However, if the supporting electrolyte inside the reference electrode or in the supporting electrolyte solution reacts with the sample to be measured and the sample solvent in the ion-permeable glass, causing clogging, the sample holder dia 9 mm (Fig. 4-1) should be used.
- Instead of immersing the non aqueous reference electrode directly into the sample, place the supporting electrolyte solution in the sample holder (Fig. 4-3 (2)) and check if air bubbles are attached to the ion-permeable porous glass at the tip of the sample holder, if bubbles are attached, shake the sample holder to remove them. If bubbles are present, the ion permeability will differ, and the applied potential may change.
- Next, insert the RE-7 Non Aqueous reference electrode (Ag/Ag+) into the sample holder (Fig. 4-3 (3)). The position of the reference electrode should be determined by moving the o-ring up and down.
- The supporting electrolyte solution to be filled in the sample holder should be the same as the solution used for the reference electrode to keep the applied potential constant.

Fig. 4-3 Non aqueous reference electrode with double junction.
If you want to use a reference electrode in this way, we recommend a cell for SVC-2 Voltammetry cell that can use a sample holder dia 9 mm.
When using a new sample holder, immerse the ion-permeable porous glass part overnight in the liquid to be used. The porous portion of the ion-permeable porous glass is permeated with the liquid to allow ions to pass through, allowing experiments such as cyclic voltammetry to be performed.
4-0-5 Storage method for each reference electrode
⁘ How to store each reference electrode before use
When you receive the reference electrode for electrochemical measurements (the type containing the internal solution), store it immediately as shown below (example: silver/silver chloride reference electrode) so that the ion-permeable porous glass at the tip of the electrode does not dry out. (★ For reference electrodes with an outer diameter of 6 mm, it is convenient to use the RE-PV Preservative vial for reference electrode for storage.)
Please note that if left unused for a long period of time without any action, the product may become unusable.

Fig. 4-4-1 Right way to storage the reference electrode.

Fig. 4-4-2 Wrong way to storage the reference electrode, with too much storage solution.

Fig. 4-4-3 Wrong way to storage the reference electrode, with entire electrode placed in a beaker.
- If there is too much storage solution, the entire electrode will be immersed in the solution, and the metal pins of the electrode will be corroded.
- If the entire electrode is placed in a beaker, the metal pins of the electrode will be corroded due to NaCl crystal deposition.
⁘ How to store each reference electrode after use
| Product | Storage method |
| RE-1B Reference electrode (Ag/AgCl) ⁕ | Store in 3 M NaCl solution or cover the tip with parafilm |
| RE-1BP Reference electrode (Ag/AgCl) ⁕ | |
| RE-1S Reference electrode (Ag/AgCl) | |
| RE-3VT Reference electrode screw type (Ag/AgCl) | |
| RE-1CP Reference electrode (Ag/AgCl/Saturated KCl) ⁕ | Store in saturated KCl solution or cover the tip with parafilm |
| RE-2BP Calomel Reference electrode ⁕ | |
| RE-2CP Reference electrode ⁕ | Store in saturated K2SO4 solution or cover the tip with parafilm |
| RE-7 Non Aqueous reference electrode (Ag/Ag+) ⁕ | Stored in acetonitrile/0.1 M TBAP solution/0.01 M AgNO3 |
| RE-7S Non Aqueous reference electrode (Ag/Ag+) | |
| RE-7VT Non Aqueous reference electrode screw type (Ag/Ag+) |
※ When perchlorate is used as the supporting electrolyte, the KCl type reference electrode reacts and crystallizes as KClO4 with low solubility, which adheres to the porous part of the ion-permeable porous glass and change its potential. This increases the impedance and eventually generates noise, making the electrode unusable.
4-1 RE-2BP Calomel Reference electrode
⁘ 1) Introduction of electrodes
This reference electrode is a saturated calomel electrode developed for electrochemical measurements.
It can also be used with the SVC-2 Voltammetry cell, SVC-3 Voltammetry cell, SBC Bulk electrolysis cell, etc. sold by BAS.
The electrode can be refilled with saturated KCl solution for reuse.
⁘ 2) Structure
RE-2BP Calomel Reference electrode is made of polymethyl pentene, which has excellent chemical resistance. The ceramic material is used for the liquid junction at the tip to facilitate the permeation of ions.
⁘ 3) How to use

4-2 Handling of RE-7 Non Aqueous reference electrode (Ag/Ag+)
The RE-7 Non Aqueous reference electrode (Ag/Ag+) for electrochemical measurements is a reference electrode used to measure cyclic voltammograms of samples that can only be dissolved in organic solvents. This section describes the manufacturing details for using this reference electrode.
⁘ 1) Preparation
- Make sure that the Ag wire and male pin are fixed to the Teflon cap.
- Check that the ion permeability porous glass is fixed to the tip of the sample holder.
- Check the supplied non-aqueous reference electrode solution.
- Prepare a pipette or syringe.
⁘ 2) Preparation of Ag/Ag+ reference electrode
- Add about 0.6 mL of the attached internal solution to the sample holder using a pipette.
- Set the Teflon cap.
- Cover the connection part of the cap and the sample holder with parafilm to prevent evaporation.
- If there are air bubbles around the tip of the electrode (ion-permeability porous glass part), gently flick it with fingers to remove the air bubbles.
")
- Sample holder dia 6 mm (1 pc) (=012176 Sample holder dia 6 mm (2 pcs))
- RE-7 Teflon cap with Ag wire
- RE-7 Electrolyte solution (3 mL)
- Instruction manual
- The following solutions are used as non-aqueous reference electrode solutions.
- 1. acetonitrile (ACN)
- 2. Dimethylformamide (DMF)
- 3. Dimethyl sulfoxide (DMSO)
- 4. Propylene carbonate (PC)
- Next, the following reagents are used as the supporting electrolyte for the above solution.
- 1. Tetrabutylammonium perchlorate (TBAP)
- 2. Tetraethylammonium perchlorate (TEAP)
- 3. Tetrabutylammonium hexafluorophosphate (TBAPF6)
- 4. Tetraethylammonium fluoroborate (TEABF4)
⁘ 3) Regeneration of electrode
- Fill the glass body with acetonitrile/0.1 M Tetrabutylammonium perchlorate (TBAP)/0.01 M AgNO3 solution.
- Clean the Ag wire with acetone.
- The storage method is to soak in an electrolyte solution. 0.01 M AgNO3/acetonitrile/0.1 M TBAP or acetonitrile/0.1 M TBAP with silver ions removed.
- Notes:
- If the ion permeability porous glass is completely dry, salt may crystallize inside porous, causing the ion permeability porous glass to crack. Keep the tip of the ion permeability porous glass wet.
- Soak the tip of the ion permeability porous glass in an organic solvent for at least one hour before assembling it as an electrode.
- If there are air bubbles attached to the ion permeability porous glass part, remove them by gently flicks.
- If salt crystallizes and adheres to the inside of the sample holder and Teflon cap, it will be difficult to insert the Teflon cap, so please wash it with acetonitrile.
- If you prepare your own reagents, please use a special grade or higher reagent.
Section 5: Measurement of small amount sample
5-0 SVC-2 voltammetry cell: Small sample mode
A typical cell for electrochemical analysis requires a sample volume of about 5 to 10 mL. However, for expensive and valuable samples, the sample volume will naturally be smaller.
The SVC-2 voltammetry cell for small volume measurement mode allows electrochemical measurements with sample volumes of 100 µL to 200 µL.
For measurements, we offer working electrodes with an outer diameter of 6 mm or 3 mm.
For CV measurement, in advance, fill the sample holder and cell vial with the same concentration electrolyte. Place a Teflon tube in the cell or sample holder and purge with N2 gas to remove dissolved oxygen.
The counter electrode is setting in a cell filled with the supporting electrolyte. If the solution is conductive and the current is low, this is sufficient for measurement. However, ion permeable glass can cause iR drop, especially when organic solvents are used.
In such cases, it is recommend to place the counter electrode in the sample holder as shown in the figure below. In this case, use a working electrode with an outer diameter of 6 mm or 3 mm. If the oxidation/reduction potential of the data obtained using the sample holder is shifted more than expected, an iR drop has occurred. Ion permeable glass is dry when delivered and should be immersed in the supporting electrolyte solution for at least 1 hour before use to reduce the resistance. Once the ion permeable glass has been moistened, it should not be allowed to dry. During the experiment, the ion permeable glass part should be immersed in the supporting electrolyte solution.

| Catalog No. | Description |
| 012668 | SVC-2 Voltammetry cell |
| Optional item | |
| 012177 | Sample holder dia 9 mm (2 pcs) |
5-1 SVC-3 Voltammetry cell
The SVC-3 voltammetry cell is the standard type of voltammetry cell for electrochemical measurements. Microelectrodes can also be set in the hole for working electrode. Compared to the SVC-2, it can be used with many types of counter electrode. In addition, the cell is hermetically sealed, making it effective for experiments that are easily affected by dissolved oxygen.
5-2 SVC-2 Voltammetry cell
The SVC-2 voltammetry cell used for electrochemistry measurements is:
- Normal measurement
- Measurements with a working electrode of 10 mm OD
- 100 ~ 200 µL small sample measurement
- Low temperature measurements using microelectrodes
The cell is conveniently designed to be used in four ways.
In addition, since it has a sealing property, it is also effective for experiments that are easily affected by dissolved oxygen.
5-4 Various types of cell vials
We sell glass cells for electrochemical measurements for various applications. The cells are made of hard glass for acid to neutral solution and polymethyl pentene for alkaline solution, which can be applied for physical and chemical applications. We also introduce products that can be used with various optional devices, so you can select the cell that best suits your application.
5-5 Bulk electrolysis cell
The SBC bulk electrolysis cell used for electrochemical measurements is a cell for complete electrolysis of solution species.
Typical uses include determination of the number of electrons transferred per molecule, absolute measurement of analytical species, and electrolytic synthesis of new materials (usuaaly about mg). The cell consists of a porous carbon electrode as the working electrode, a platinum counter electrode, a chamber that can isolate it, and an Ag/AgCl reference electrode (reference electrode sold separately).
By removing the port plug inserted in the hole of the Teflon cap, a working electrode with a diameter of 6 mm can be installed. The 6 mm O.D. working electrode can be used to check the progress of electrolysis. A gas purge tube and stirrer bar for deoxygenating and stirring the solution are also included.
Water jacketed bulk electrolysis cells are also available if temperature control is required during electrolysis.
In addition to the standard porous carbon electrode, a platinum mesh electrode is also available as a custom-made working electrode for this cell.
Section 6: Polishing method
In electrochemical measurements, the purpose of electrode polishing is to remove redox reaction products that have accumulated while using the electrodes. The reaction rate (corresponding to the attenuation of the response) that coats the electrode depends on the following factors:
- Electrolyte molecules
- Electrolyte solution concentration
- Electrolyte solution
- Applied voltage
- Frequency of use
The polishing process is to scrape the electrode surface to create a new electrode surface. The following precautions should be taken when handling and polishing working electrodes.
- Polish the electrodes on a hard and flat surface. When polishing, the electrode (especially the working electrode) should be as parallel to the polishing surface as possible. This will result in a flat peak surface.
- Do not remove the electrode material from the electrode. Be careful not to damage the contact surface between the electrode and the main body or the surface of the electrode.
- Do not heat the electrodes above room temperature.
- Use only ALS abrasives. If you use another company's abrasive, we cannot guarantee it.
6-1 PK-3 Electrode Polishing kit
The PK-3 Electrode Polishing kit is packaged for polishing precious metal and glassy carbon electrodes used in electrochemical measurements. For example, when using a gold electrode as a mercury amalgam electrode.
The final performance of the thin-layer mercury cell depends on the finish of the electrodes. Electrodes with a mirror-like finish are very good electrodes.
6-2 PFCE electrode polishing
The PFCE graphite carbon electrode used for electrochemical measurement is easier to polish than the glassy carbon electrode, anyone can easily obtain excellent electrode sensitivity and reproducibility by performing a certain polishing method, when electrode properties deteriorate or the electrode surface becomes dirty.
| Catalogue No. | Description | Quantity | purpose |
| 012611 | Emery paper UF800 (20 pcs) | 1 | For PG and PFCE electrodes |
6-3 Polishing of glassy carbon electrodes
There are three steps to polishing the working electrode used for electrochemical measurements, but it is not always necessary to perform all three steps. Select the appropriate abrasive depending on the condition of the electrode surface.
Step 1: Remove large depressions in the glassy carbon surface (using emery paper and distilled water).
Step 2: Roughly polish the electrode surface (using polishing diamond and diamond polishing pad).
Step 3: Finish (using polishing alumina and alumina polishing pad).
For effective polishing, each pad and electrode surface should be rinsed with water at each stage. Running water should be used to rinse the abrasives from the electrode surfaces and to avoid mixing the different abrasives. In particular, before moving to the final (third) step of alumina polishing, be sure to clean the electrode surface because the particle size is different (see Fig. 6-1).

Fig. 6-1 Polishing of glassy carbon electrodes.
- Prepare the glass plate, and put a few drops of polishing diamond on a wetted diamond polishing pad.
- Hold the CV electrode at right angle to the pad, and polish in a circular motion.
- Replace the diamond pad to an alumina polishing pad, put a few drops of polishing alumina, and polish the electrode to be mirror surface. Rinse the electrode surface with distilled water, and finish by air drying.
- Using a new alumina polishing pad, polish few times the electrode (for removing the alumina particles remaining on the electrode surface). Rinse the electrode surface with distilled water, and finish by air drying.
1) Rough polishing
This polishing is performed by dripping water on the rough polishing pad (see Fig. 6-1-1). Moisten the surface of the rough polishing pad thoroughly with water, place the electrode surface on the pad, and polish by applying light force in a figure of 8 motion (see Fig. 6-1-3). Do not apply strong force, as this will cause big scratches on the electrode surface. To maximize the use of the polishing pad, make a circular motion over the entire pad. After about 30 seconds to 2 minutes of polishing, the large dents on the surface disappear.
If polishing for a long time, add water or replace the pad. Thoroughly wash away any dirt from the electrodes before moving on to the next step.
2) Intermediate polishing
This polishing process uses polishing diamond and a diamond polishing pad (see Fig. 6-1-2.). After shaking the polishing diamond well, apply about 8 to 10 drops on the pad to start polishing. After polishing for about 2 minutes, the surface will shine. Before the next finishing step, thoroughly wash off the polishing diamond and wipe the electrode surface with acetone to remove the abrasive.
3) Finish polishing
In this final finish polishing step, scratches on the electrode surface are removed. Drop about 10 drops of water on the alumina polishing pad (to the extent that the pad gets wet), put a few drops of polishing alumina on it, and start polishing (see Fig. 6-2-2 and 3). After 3 to 4 minutes, rinse the abrasive thoroughly with distilled water and wipe the surface with a soft paper.
6-4 About amalgam electrodes
It is specially designed to facilitate oxidation and reduction reactions on mercury electrodes.
This type of electrode is characterized by the presence of an auxiliary electrode directly above the working electrode in the thin-layer cell. The advantage of using mercury as the electrode material is the ability to apply a deep negative potential.
In this electrode, mercury drops are dropped onto the gold electrode surface to form a thin layer of mercury. Instead of HMDE and DME, which are adversely affected by vibration and system instability, the thin-layer process eliminates such concerns. In this system, dissolved oxygen must be completely removed from the mobile phase because dissolved oxygen is easily reduced on the mercury surface.
1) Gold/mercury electrode storage
When this electrode is used for the first time or has not been used for a long period of time, a new mercury film must be created on the gold electrode surface. To do so, first remove and clean the old amalgam, then re-polish the gold electrode surface and form a new amalgam on that surface.
2) Removal of old amalgam
1. When 6N nitric acid is dropped on the electrode surface, the amalgam dissolves and the color of the solution changes from gray-black to yellow.
2. If this reaction does not occur within 2 minutes, replace the nitric acid solution.
3. Scrape the electrode surface with the tip of a glass pipette while dropping the nitric acid solution.
4. After the color changes, rinse with distilled water and move on to the next step (see Fig. 6-2).

Fig. 6-2 Removal of mercury amalgam.
3) Regeneration of gold electrode surface
The final quality of the thin-layer mercury electrode will affect the quality of the gold surface. In general, the smoother and more mirror-like the electrode, the better the electrode. Mirror finish is difficult with manual polishing, but it can be easily finished by the following procedure.
This procedure consists of three steps, but it is not necessary to perform all of them. For example, it may be possible to prepare a new mercury film without polishing.
Step 1: Eliminate large dents in the gold surface in order to quickly remove decomposed mercury and form a uniform amalgam.
Step 2: Rough polishing.
Step 3: Finish in good condition for amalgam formation.
All of these steps can be performed with the items in the polishing kit. In order to maximize the polishing results and to extend the life of each pad, each step should be followed by a rinse with water. Running water should be used to rinse the abrasive from the electrode surfaces, to avoid mixing of the different abrasives.
Be sure to clean the particles, especially before moving on to the final stage, alumina polishing, because of the different particle sizes. After the old mercury amalgam has been acid-treated to a faded yellow gold surface, the next polishing is performed to attach the new amalgam.
4) Rough polishing
1. Moisten the surface thoroughly with water.
2. Press the electrode surface on it, move it in a circular motion, and apply light force.
(Do not apply a large force. It will cause a big scratch on the gold surface.)
3. To make the best use of the polishing pad, draw a circle throughout the pad.
4. After polishing for about 30 seconds to 2 minutes, the surface will turn golden.
5. When polishing for a long time, add water or replace the pad.
6. Thoroughly wash off dirt from the electrodes before moving to the next step.

Fig. 6-3 Rough polishing of the electrode surface.
5) Intermediate polishing
1. Shake the diamond abrasive well.
2. Drop about 8 to 10 drops on the pad and start polishing until the surface of the gold starts to shine.
3. Thoroughly rinse off the abrasive before moving on to the next finishing step.

Fig. 6-4 Diamond polishing of electrode.
6) Finish polishing
In this final step, the gold surface is finished to a mirror-like finish.
- Add 10 to 20 drops of water on the alumina polishing pad (brown felt pad) (enough to moisten the pad) and add 5 to 6 drops of polishing alumina on the pad to start polishing (see Fig. 6-4).
- After 3 to 4 minutes, rinse the abrasive thoroughly with distilled water.
- The surface is in good condition to make mercury amalgam electrodes.
- If you wipe the surface with soft paper, the surface of the gold electrode will shine.
- Small scratches on the surface do not significantly affect the performance of the cell, but if the scratches are large, the cell should be re-polished again.
7) Preparation of mercury amalgam
This is easy and quick and does not require any special skills. Mercury is volatile, so store it in the designated airtight container. A mercury film on a gold surface is created by placing a small amount of mercury on a polished gold surface (see Fig. 6-5). The gold surface should be completely covered with mercury.
After 2 to 3 minutes, scrape off the excess mercury.
After removing the mercury, wipe the surface with a soft, dry tissue until it shines like a mirror.

Fig. 6-5 Method of making mercury amalgam electrode.
If excess mercury is left on the surface, it can short-circuit the counter electrode and cause noise. In such cases, add one more gasket (TG-8M). It is not necessary to always remove the old mercury with each new mercury film.
The new mercury amalgam can be layered on the old mercury. After cleaning the surface with water and methanol, apply a small amount of mercury to the surface of the old amalgam.
Excess mercury is removed as described above. After wiping off the mercury with a dry tissue, the electrode is ready for use. The surface is rougher than when they were re-polished, but both are equally shiny.
Usually, after amalgamization, it takes time to stabilize. Let stand for at least 6 hours to form a mercury amalgam electrode. If the amalgam electrode is used without leaving it for 6 hours, a very high background will be generated and the electrode response will change, so this stabilization must be performed. Also, be sure to check the sensitivity before measuring the sample.
When using an amalgam electrode to measure thiol substances such as glutathione, the dissolved oxygen in the mobile phase is a source of noise, so highly sensitive analysis is not possible unless the dissolved oxygen in the mobile phase is removed by gas purging such as helium, or the oxygen is removed online by continuous degassing with the degasser.
6-5 Preparation of carbon paste electrode
This section describes how to prepare carbon paste electrode for electrochemical measurements.
The feature of this electrode is that a new electrode is prepared each time the carbon paste is filled and polished.
During the preparation, please wear a lab coat, as carbon paste will stain your clothes.
Carbon paste can be easily used to study compounds that dissolve in aqueous systems, for example, mixing chemicals and carbon paste to create chemically modified electrodes, or mixing enzymes and carbon paste to create enzyme electrode.
Carbon paste is soluble in organic solvents.
When not in use, the carbon paste should be stored in a tightly closed vial as it is prone to contamination.
Preparation method of carbon paste electrode
The following figure shows a working electrode for a flow cell, but the preparation method is the same for a CV working electrode.
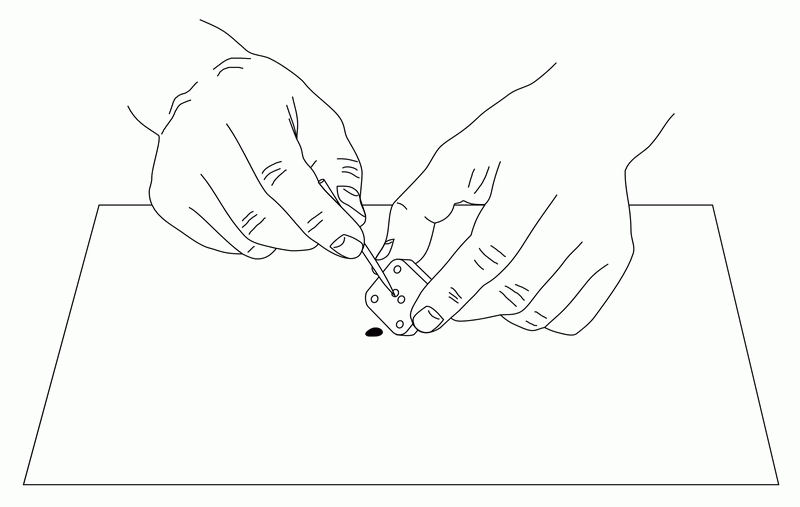
Fig. 6-6 Remove old carbon paste from the electrode holes with a pointed instrument (such as a toothpick).
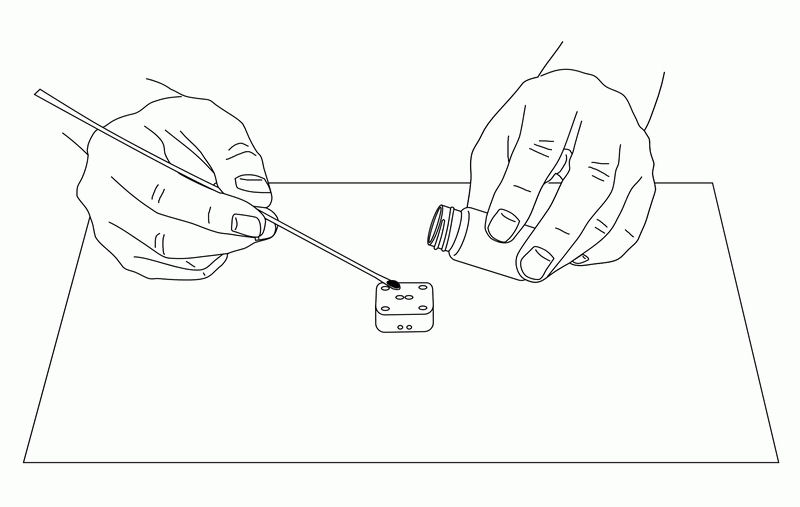
Fig. 6-7 Pile up carbon paste in the holes of the electrode with a spatula.
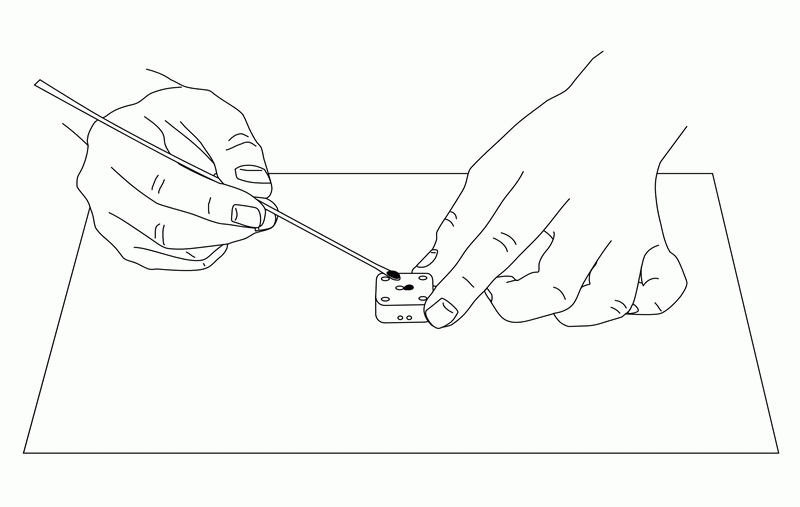
Fig. 6-8 Fill the holes of the electrodes with carbon paste.
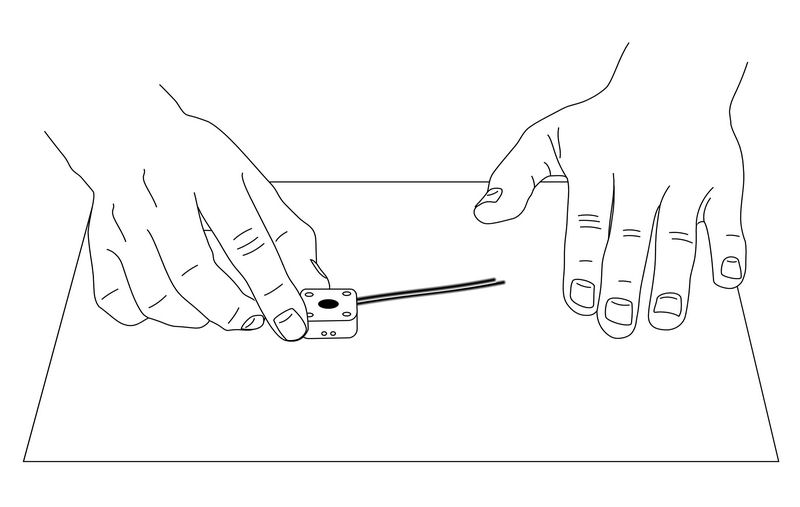
Fig. 6-9 Remove excess carbon paste on flat paper.
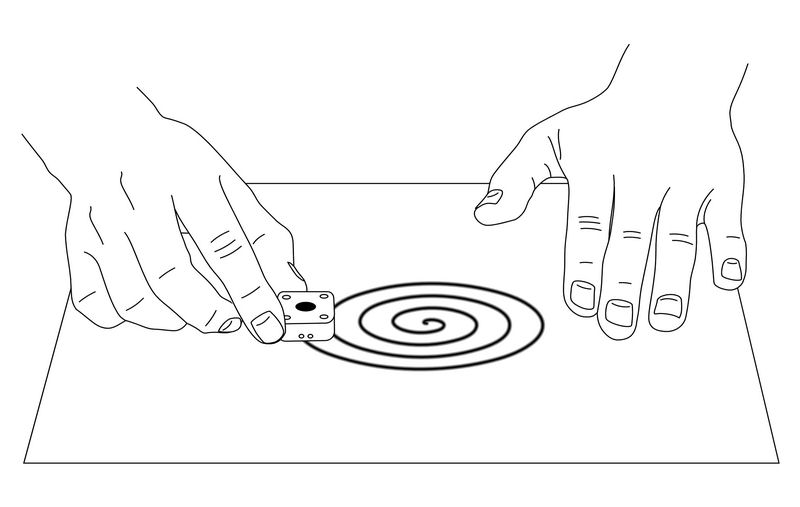
Fig. 6-10 Polish the carbon paste electrode surface on a flat piece of paper.