5. Program operation
Explanation of graph for SPR measurement:
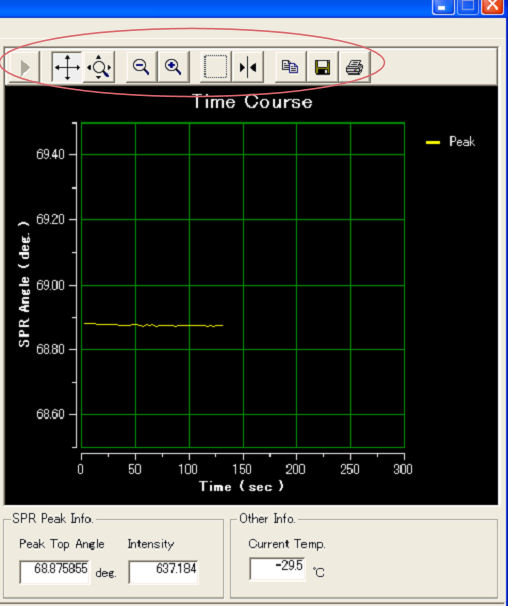
Click image for another view |
(1) Clicking on this icon, the graphical representation range becomes at initial value.
(2) Clicking on this icon, display position of graph is changed.
(3) Expansion or reduction of graphical display is possible after clicking on this icon.
(4) After selecting this icon, reduce the window with left click on graph.
(5) After selecting this icon, expand the window with left click on graph.
(6) Zoom Box.
(7) If it clicks on graph, the value of the coordinates in the place can be displayed.
(8) Copy to clip Board.
(9) Save on file.
(10) Copy.
Data save:
There are three different ways to save data in the file. Data saving process is quite easy and understandable. At first, click on files of “Handy- SPR Control Program” and three different saving panels will appear narrated as follow:
1. Save Peak Data- Data at different angle changes with time are saved as CSV file.
2. Save Current Curve-The data of SPR curve are saved on CSV file.
3. Save All SPR Data- All the data can save using save all SPR data function.
Then, we can open those files in MS-Excel and analyze all data as usual.
 |
| Catalog No. | Description |
| 012072 | Handy SPR PS-0109 |
| Components | |
| Transmission cable | |
| Power cable | |
| Software | |
| 011870 | Matching oil |
| 011869 | Gold chip |
| 011871 | PDMS flow cell |
![]()