This content explains the basics and applications in electrochemistry.
The topics are listed below:
- Part 1: Potentiostat circuit configuration and its features
- Part 2: Bi-Potentiostat
- Part 3: Positive Feedback
- Part 4: The solution resistance and the iR compensation
- Part 5: Electron transfer rate
- Part 6: Redox Potential
- Part 7: Electrochemical Impedance Spectroscopy (EIS)
- Part 8: CV (Cyclic Voltammetry)
Part 5: Electron transfer rate
Professor Noriyuki Watanabe
A method using CV to obtain electron transfer rate (ks),which announced about 50 years ago is usually used (Ref. 5-1).
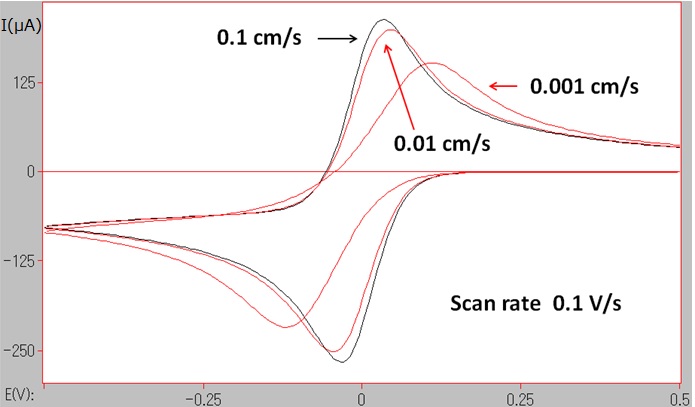
At room temperature, for the single electron transfer reversible reaction,ΔEp is slightly less than 60 mV, this value will increase if the electron transfer rate changed to be slower.
This state can be shown in Fig. 5-1 by CV simulation.

Fig.5-1 CV simulations at different electron transfer rates (ks = 0.1, 0.01, 0.001 cm/s).
The electron transfer rate is depended on the activation energy amount during the electron transfer process, and is also influenced by the molecule structure change and the change of the solvation before and after the electron transfer process.

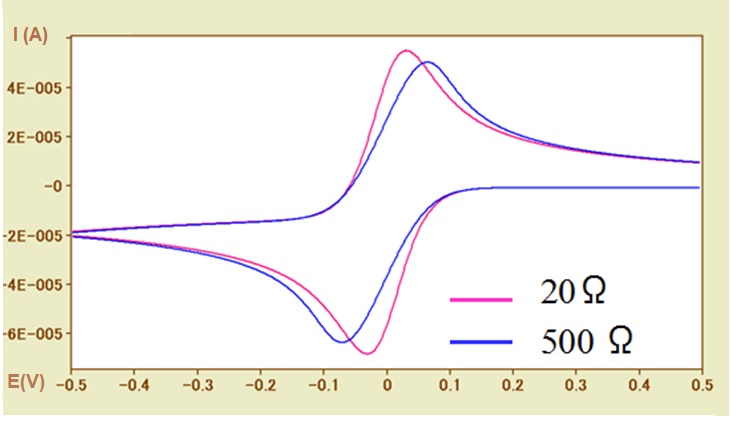
Fig.5-2 CV simulations for different solution resistances (Ru = 20Ω, 500Ω).
Examining such kinetic parameter as well as investigating the redox potential which is a thermodynamic parameter, are the important objectives in electrochemical measurements.
Incidentally, the peak potential width (ΔEp) does not only change due to the electron transfer rate, but also the uncompensated solution resistance may greatly influence it. So far this has been mentioned several times.
Such situation can be shown in Figure 5-2. by CV simulation.
In the case of a fast electron transfer rate reaction system (ks = 0.1 cm / s), the CV curves of the uncompensated solution resistances of 20Ω (pink line) and 500Ω (blue line) are compared. With the increase of the solution resistance, the widening of the peak potential width (ΔEp) has a dependence on the solution resistance, which similar to the influence of the electron transfer rate, can be observed. The necessary of examining whether the solution resistance has influence in determining the electron transfer rate should be noted here.
In addition, the redox potential is calculated using the average value of the peak potential. However, the potential difference between the oxidation peak and the reduction peak is caused by the solution resistance, and thus the possibility of inequality should be considered also (although it is a trivial matter). In other words, the absolute values of the oxidation and reduction peak current values of are usually not exactly the same.
In Fig. 5-2, the baseline current of the oxidation peak is negative value, so the absolute value of the oxidation peak current is less than that of the reduction peak current with the zero baseline current.
Since the influence of the solution resistance on the potential shift is effective at the current (I) × solution resistance (R) (IR drop) result, therefore the current value is also quite important. By reducing the concentration of the electroactive species, or decreasing the electrode surface area (in the extreme case, the microelectrode can be used), etc. to reduce the current value, then to judge whether there is any effect of the solution resistance.
Reference:
5-1)R. S. Nicholson, Anal. Chem.,37, 1351 (1965)

