This is a basic content about the types of working electrodes used for electrochemical measurement, their uses, and selection methods, for beginners in electrochemical measurement.
The topics are listed below:
- Part 1: General Remark
- Part 2: Polarizable electrode and nonpolarizable electrode
- Part 3: Metal electrodes such as gold and platinum
- Part 4: Usually used working electrodes & features
- Part 5: Structure of GC & Electrochemical features of basal/edge plane
- Part 6: Glassy carbon electrode surface state characteristics
- Part 7: Glassy carbon electrode surface impurity adsorption and countermeasures
- Part 8: Adsorption of catechol and derivatives on glassy carbon electrode and electron transfer rate
5. Structure of GC & Electrochemical features of basal/edge plane
Professor Noriyuki Watanabe
Although the most commonly use glassy carbon (GC) material has a graphite structure in microcosmic viewpoint, it has an irregular structure in macroscopic viewpoint which is easily imagined from its name.
Benzene ring condensation together plane (multiple hexagonal honeycomb) in two dimensions are overlapped by layers. The benzene condensation similar plane is called basal plane, and the surface at perpendicular direction is called edge plane which has layer appearance. Knowing the different responses of basal plane and edge plane is helpful in understanding the GC.

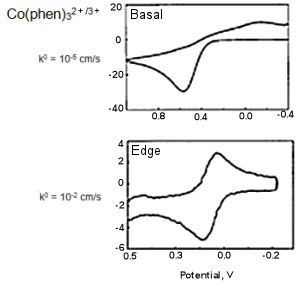
Fig. 5-1 CV comparison of Basal and Edge plane.
Fig. 5-1 Showed the results obtained by measuring Co(phen)32+/3+ using basal plane and edge plane of HOPG (McCreery et al., Anal. Chem., 64, 2518, (1992), McCreery, Chem. Rev., 108, 2646 (2008).
The electron transfer rate calculated from the difference of the redox peak potential (ΔEP) are differed in 3 orders, and the electron transfer rate on basal plane is obviously slower.
Even if a new basal plane is obtained by peeling, due to the peeling operation and the increased stress when the electrode was assembled into the mold, obtaining an ideal basal plane is extremely difficult.
Therefore, McCreery et al. did the measurements by using a special method known as an inverted drop cell (see the cited literature if interested).
Three different basal plane orderliness electrodes were compared by using potassium ferro-ferricyanide sample, as shown in Fig.5-1. The orderliness decreased from A to B and C.
ΔEP (oxidation-reduction potential difference peaks) of the potassium ferro-ferricyanide cyclic voltammogram measured with high orderliness A is about 700 mV (the electron transfer rate becomes slower and ΔEP becomes lower) Large. The potential difference of the reversible reaction is 59 mV at 25°C).

Fig. 5-2 Voltammograms of Fe(CN)6-3/-4 (1 M KCI) on three HOPG basal plane surfaces with different defect density. Solid lines are experimental in all cases. (A) Dashed line, simulated for k0obs = 6.1 x 10⁻⁵cm/s, a0 = 0.51, dα/dE = 0.30 V-1; dotted line, simulated for k0obs = 1.2 x 10⁻⁵ cm/s, α = 0.51, dα/dE = 0.0. (B) Dashed line, simulated for k0obs = 1.4 x 10⁻³ cm s-1, α0 = 0.50, dα/dE = 0.30 V-1. (C) Dashed line simulated for k0obs = 0.018 cm s-1, α0 = 0.50, dα/dE = 0.30. Simulation for dα/dE = 0.0 is identical to dashed line. Scan rate = 1.0 V/s in all cases. Potentials are vs Ag/AgCl.
The solid line is the measured CV curve and the dashed line is the simulated curve (introduction omitted here). Decreasing the constant of electron transfer rate, and adding the potential dependence of the transfer coefficient during simulation processing, it is shown that actual measurement can be reproduced by simulation. A reversible CV curve was obtained when lower basal orderliness C was used. The lower the orderliness of the base plane, the faster the electron transfer rate.
References:
5-1) McCreery et al., Anal. Chem., 64, 2518 (1992).
5-2) McCreery, Chem. Rev., 108, 2646 (2008).
5-3) McCreery et al., J. Phy. Chem., 96, 3124 (1992).

