Part 7: Electrochemical Impedance Spectroscopy (EIS)
This is a basic introduction to the electrochemical measurement method electrochemical impedance spectroscopy (EIS).
The topics are listed below:
- EIS I: Basis for analysis of EIS results using equivalent circuits
- EIS II: Frequency variation and EIS measurements
- EIS III: Nyquist plot of circuit elements
- EIS IV: Warburg Impedance
- EIS V: Constant Phase Element Nyquist Plot
- EIS VI: Consider a system consisting of three elementary processes
- EIS VII: Nernst diffusion
- EIS VIII: Finite diffusion
- EIS IX: Dye-sensitized solar cell (DSSC) EIS - 1
- EIS X: Dye-sensitized solar cell (DSSC) EIS - 2
- EIS XI: Summary
EIS I: Basis for analysis of EIS results using equivalent circuits
Professor Noriyuki Watanabe
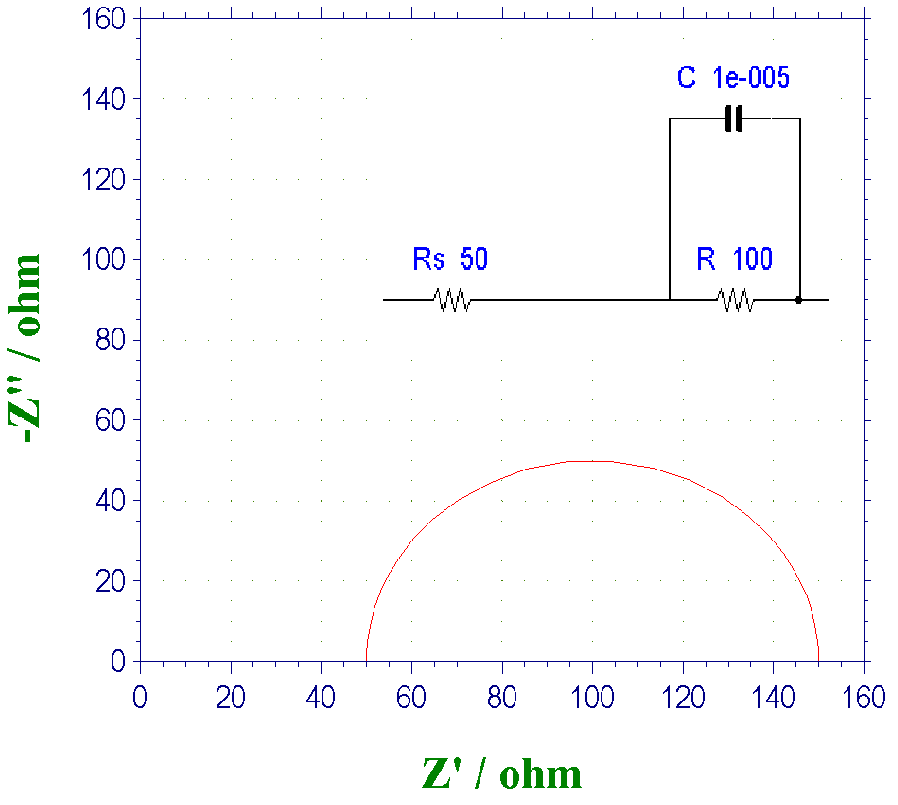
In the Part 10: Redox Potential - V the discussion of redox potential finished, from this chapter the EIS (Electrochemical Impedance Spectroscopy) will be discussed. The most common method of EIS is the semicircular Nyquist plot shown in the figure below (the terminology of Nyquist plot will be explained later).
Why does it appear so often? Much of the usual electrochemistry deals with heterogeneous systems, that is, charge transfer phenomena at the electrode-solution interface. At the heterogeneous interface, a double layer with pairs of positive and negative charges is formed. That is, electrical capacity, which requires activation for charge transfer, which corresponds to an electrical resistance. These two generally occur simultaneously in parallel, and not in a sequential process, one after the other. There are so many states and phenomena that are replaced by parallel circuits (simultaneous processes) of resistance and capacitance.

Fig.11-1. Example of Nyquist plot.
Following, the usefulness of Nyquist plot will be explained. The real and imaginary components of the impedance response when a small amplitude variable frequency AC potential is applied to the working electrode are plotted on the horizontal and vertical axes with frequency as a parameter. At high frequencies, the interface impedance can be regarded as zero because the impedance due to the capacitance C approaches zero (the charge transfer resistance does not work because it is equivalent to being shorted circuit). Then, only solution resistance remains. In other words, from the intersections of the semicircle and the real axis, the one closest to the origin corresponds to the resistance value of the solution Rs. On the other hand, at low frequencies, the impedance derived from the capacitance becomes very large, and as a result, only the charge transfer resistance component becomes visible. The sum of the resistance of the solution Rs and the charge transfer resistance R corresponds to the intersection (at frequency zero) of the semicircle and the real axis far from the origin. From the frequency fmax of the apex of the semicircle (in Nyquist plot, the frequency is a hidden parameter, it is obtained from other Bode plots), and the capacitance value can be calculated using the relation fmax = 1 / (2πRC). In this way, you can know the three values you want to find.
The reciprocal of fmax is time, which provides information such as the relaxation time, duration, and lifetime of the process. In general, on the Nyquist plot, high frequencies correspond to those closer to the origin and those far away correspond to frequency zero. The above is the typical usage of Nyquist plot.

