Part 7: Electrochemical Impedance Spectroscopy (EIS)
This is a basic introduction to the electrochemical measurement method electrochemical impedance spectroscopy (EIS).
The topics are listed below:
- EIS I: Basis for analysis of EIS results using equivalent circuits
- EIS II: Frequency variation and EIS measurements
- EIS III: Nyquist plot of circuit elements
- EIS IV: EIS IV: Warburg Impedance
- EIS V: Constant Phase Element Nyquist Plot
- EIS VI: Consider a system consisting of three elementary processes
- EIS VII: Nernst diffusion
- EIS VIII: Finite diffusion
- EIS IX: Dye-sensitized solar cell (DSSC) EIS - 1
- EIS X: Dye-sensitized solar cell (DSSC) EIS - 2
- EIS XI: Summary
EIS VII: Nernst diffusion
Professor Noriyuki Watanabe
Special case of diffusion The diffusion we are considering (Warburg diffusion) is the case when the boundary conditions of semi-infinite one-dimensional diffusion hold. Then, what happens when the boundary conditions of semi-infinite one-dimensional diffusion do not hold? For example, there are cases where the movement of the active material in the modified electrode; the restricted range of movement of electrons and ions, as in the case of dye-sensitized solar cells and perovskite solar cells; and the formation of a fixed diffusion layer, as in the case of rotating electrodes. There are several different ways to handle this diffusion. Let us discuss them separately.
The first one is called the Nernst diffusion (ND) model. When the motion is limited, it can be called the finite diffusion (FD) model. Even though the thickness of the diffusion layer is finite, the movement is not limited and the rotating electrode and the proton exchange membrane type fuel cell (PEMFC) support ND diffusion. The impedance of ND is given by the following equation.

Equation 17-1
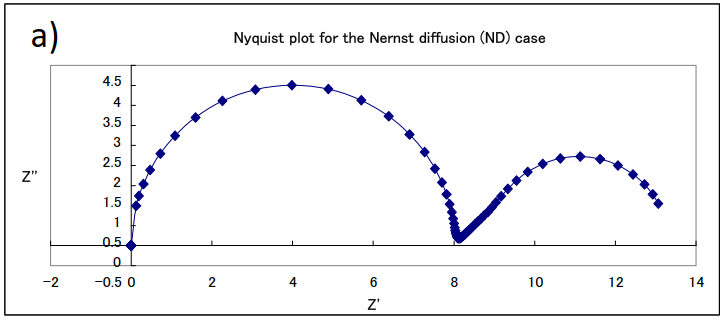
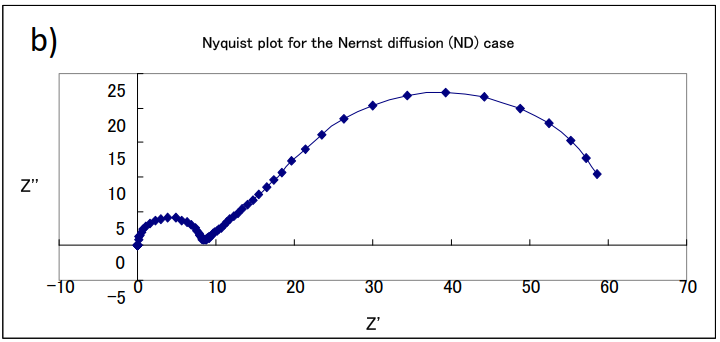
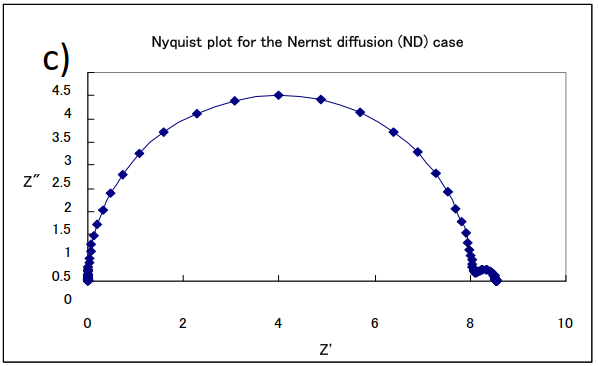
An example of a simulation curve for this equation is shown in Fig. 17-1. The change in the shape of the curve in the Nyquist plot can be seen when the parameters of concentration C and film thickness δ are changed when Rs = 0, Rct = 8, Cdl = 10-4, and D = 10-4 are the same values in (a), (b) and (c).


(a) δ= 0.1, C = 10-4; (b) δ= 0.1, C = 10-5; (c) δ= 0.01, C =10-4
The semicircles on the left high-frequency side in each figure are parallel loops of constant size due to the electron transfer on the electrodes and the double-layer capacitance at the interface (note that the horizontal axes have different sizes. They are semicircles with the same resistance value and the same diameter). It can be noticed that the length of the straight line with a slope of 45 degrees and subsequently the size of the arc on the low frequency side changes depending on the film thickness and concentration. Although there is only one electrode process, two arcs clearly appear. In the semi-infinite diffusion the low-frequency side, which was originally a straight line, forms another semicircle. Although the semicircle due to diffusion is larger than the semicircle due to the electrode process, it is also characterized by the fact that the portion of the straight line at an angle of 45 degrees to the real axis in the low frequency range is still on the high frequency side of the semicircle, which is the Nyquist diagram often seen in PEMFC and RRDE impedance measurements.

