Part 7: Electrochemical Impedance Spectroscopy (EIS)
This is a basic introduction to the electrochemical measurement method electrochemical impedance spectroscopy (EIS).
The topics are listed below:
- EIS I: Basis for analysis of EIS results using equivalent circuits
- EIS II: Frequency variation and EIS measurements
- EIS III: Nyquist plot of circuit elements
- EIS IV: Warburg Impedance
- EIS V: Constant Phase Element Nyquist Plot
- EIS VI: Consider a system consisting of three elementary processes
- EIS VII: Nernst diffusion
- EIS VIII: Finite diffusion
- EIS IX: Dye-sensitized solar cell (DSSC) EIS - 1
- EIS X: Dye-sensitized solar cell (DSSC) EIS - 2
- EIS XI: Summary
EIS V: Constant Phase Element Nyquist Plot
Professor Noriyuki Watanabe
This issue will talk about the equivalent circuit element called CPE (Constant Phase Element). The semicircle in the actual measured Nyquist plot usually appears as an irregular (deformed) semicircle, rather than an ideal semicircle shape.
This phenomenon is due to the inhomogeneity of the electrodes (inhomogeneity of potential and current density due to the geometry of the electrodes, etc., non-uniform distribution of physical and chemical properties of the various surfaces, such as concavity, adsorption and degree of coverage of the electrode surface). The CPE impedance, expressed in the following equation, is often used to describe this phenomenon.

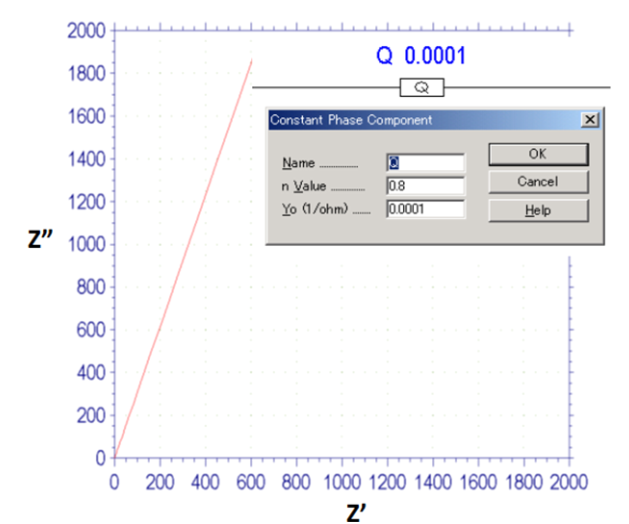
Fig. 15-1 Nyquist plot of CPE, n = 0.8.
If only the bilayer capacity is available and there is no electrode active material in parallel, or if the set potential deviates so much from the redox potential of the active material that no electrode reaction occurs (ie Rct=∞), the Nyquist plot should show a straight line rising perpendicular to the real axis. However, in practical electrochemical systems, especially in porous electrodes, a line rising perpendicular to the real axis is rarely seen, and most can be seen as a straight line with a certain slope. This situation can be seen to correspond to Fig. 15-1.
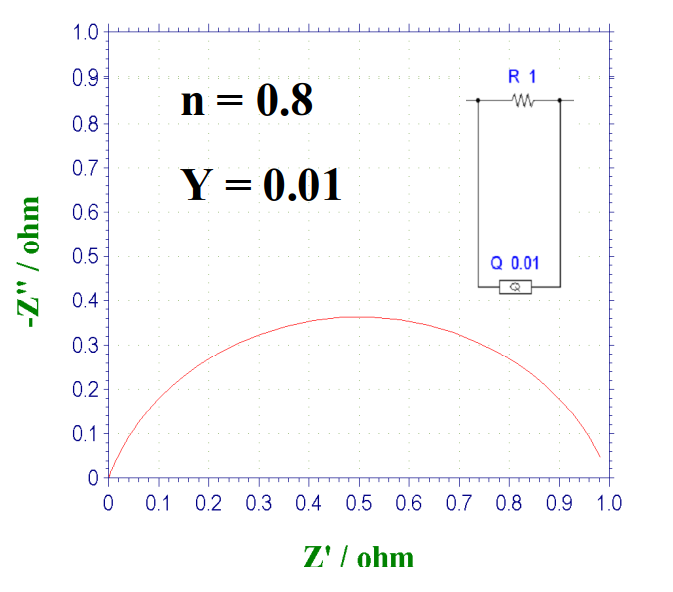
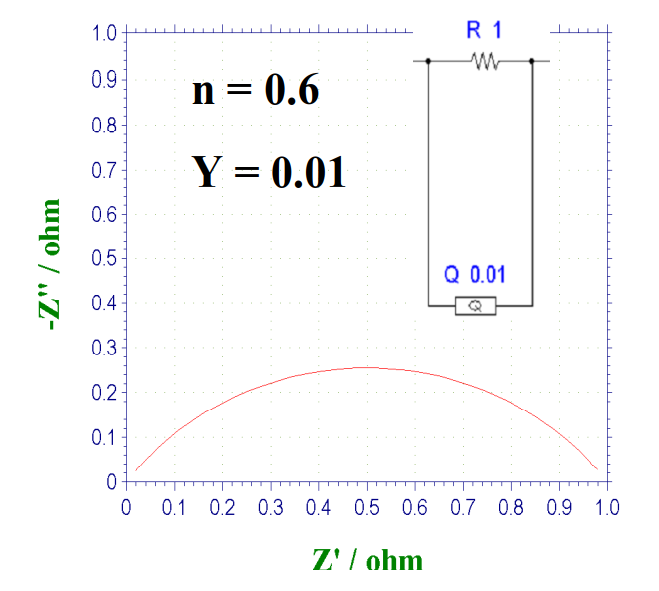
When the above case is included, the Nyquist plot will appear as a deformed and flattened arc if the CPE and the resistor are connected in parallel. When n = 0.8, the shape of the curve is shown in Fig. 15-2. As the value of n decreases further, the flattening distortion becomes more severe (Fig. 15-3).

Fig. 15-2 Nyquist plot of the parallel circuit of CPE and resistor, when n = 0.8.

Fig. 15-3 Nyquist plot of the parallel circuit of CPE and resistor, when n = 0.6.

