Part 7: Electrochemical Impedance Spectroscopy (EIS)
This is a basic introduction to the electrochemical measurement method electrochemical impedance spectroscopy (EIS).
The topics are listed below:
- EIS I: Basis for analysis of EIS results using equivalent circuits
- EIS II: Frequency variation and EIS measurements
- EIS III: Nyquist plot of circuit elements
- EIS IV: Warburg Impedance
- EIS V: Constant Phase Element Nyquist Plot
- EIS VI: Consider a system consisting of three elementary processes
- EIS VII: Nernst diffusion
- EIS VIII: Finite diffusion
- EIS IX: Dye-sensitized solar cell (DSSC) EIS - 1
- EIS X: Dye-sensitized solar cell (DSSC) EIS - 2
- EIS XI: Summary
EIS III: Nyquist plot of circuit elements
Professor Noriyuki Watanabe
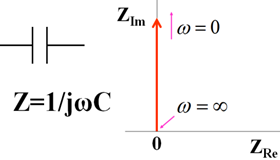
Let us look at the Nyquist diagram of the circuit components. Consider first the object consisting only of a capacitor (Fig.13-1). This is a capacitor used as a circuit element. For DC, it cannot pass the capacitor, so no current flows. This corresponds to the situation where the electrode surface is in a potential region where no redox occurs. In other words, it is an electrode in a polarized potential region. It means that the wire is cut in the middle, which means that DC current cannot pass through, which is really easy to understand. It is a symbolic representation of an entity.

Fig.13-1. Capacitance symbol, expression, Nyquist diagram.
When expressed by the mathematical formula, Z = 1 ⁄ (ωC), which coincides with the imaginary axis in the Nyquist diagram. As the frequency approaches ∞ (infinity), the impedance approaches zero (the origin in the Nyquist diagram). If the AC frequency is high, the AC current will pass easily through the capacitor. Conversely, if the frequency is zero, that is, DC current will not flow through. In other words, the impedance becomes infinite, so it becomes a straight line that diverges to infinity and rises vertically from the origin. This is the Nyquist curve of capacity (red arrow → in the figure, which coincides with the imaginary axis).
Now, what happens if you connect a capacitor to a resistor? There are two ways to connect them: in parallel or in series with the capacity. Resistance means the force that prevents electrons or ions from moving when they move. It is the element that comes along with the transfer of charge. In this case, there is no phase difference between voltage and current.

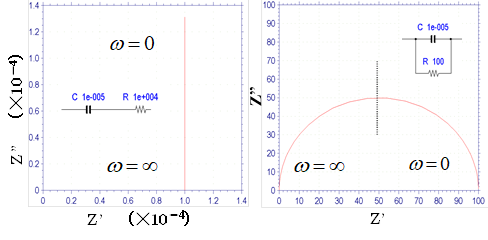
Fig.13-2. Nyquist diagram of the circuit when a capacitor and resistor are connected in series (left) and in parallel (right).
The left diagram in Fig.13-2. shows a capacitor connected in series with a resistor. The figure shows a Nyquist diagram of the capacitor that shifts the value of the resistor in the direction of the real axis. The right diagram shows a parallel circuit, and the Nyquist diagram is a semicircle. It intersects the origin at infinite frequency. In the case of high-frequency alternating current, a large amount of current is transmitted through the capacitor, and at the limit, impedance ofthe capacitor becomes zero. In the case of low-frequency alternating current, the impedance of the capacitor becomes large and the current is transmitted mainly through resistance, and at the limit of zero frequency the semicircle intersects the real axis at a position of equal magnitude of resistance.
This circuit connected in parallel can be viewed as a basic process and the resistance x capacitance = the time constant. The reciprocal of the frequency corresponding to the vertex of the semicircle is equal to the time constant. Since knowing the vertex frequency gives information about the time of the basic process, it is important to emphasize that this is used frequently. The left diagram in Fig.13-2 corresponds to a polarization electrode that has shifted its resistance value from the origin in parallel, and the right diagram corresponds to an electron transfer electrode when the solution resistance is zero, but in reality the solution resistance cannot be zero. A semicircle that has shifted the solution resistance value in parallel from the origin can usually be seen (Part 11, Fig.11-1. Nyquist legend). For the left figure, it is generally more common to see an inclined line or curve rather than a straight line that rises vertically.

