Part 7: Electrochemical Impedance Spectroscopy (EIS)
This is a basic introduction to the electrochemical measurement method electrochemical impedance spectroscopy (EIS).
The topics are listed below:
- EIS I: Basis for analysis of EIS results using equivalent circuits
- EIS II: Frequency variation and EIS measurements
- EIS III: Nyquist plot of circuit elements
- EIS IV: Warburg Impedance
- EIS V: Constant Phase Element Nyquist Plot
- EIS VI: Consider a system consisting of three elementary processes
- EIS VII: Nernst diffusion
- EIS VIII: Finite diffusion
- EIS IX: Dye-sensitized solar cell (DSSC) EIS - 1
- EIS X: Dye-sensitized solar cell (DSSC) EIS - 2
- EIS XI: Summary
EIS IV: EIS IV: Warburg Impedance
Professor Noriyuki Watanabe
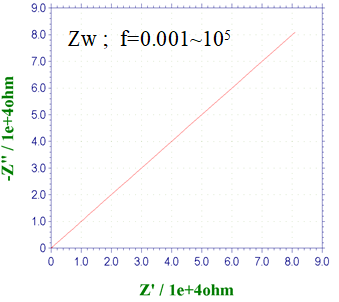
Diffusion plays an important role in electrochemical reactions. The Warburg impedance (ZW) element has been introduced for a long time to the processes in which the diffusion is involved, and it is expressed by the complex equation (1).


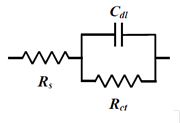
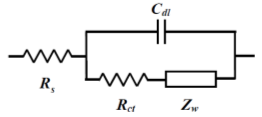
The so-called Randle's circuit (Fig. 14-2), in which the solution resistance (Rs) is connected in series with the parallel circuit of the electron transfer resistance at the electrode/electrolyte solution interface (the inverse of the electron transfer rate, Rct) ) and the interfacial double layer capacitance (Cdl) (these two are simultaneous processes), is further represented by an equivalent circuit containing the Warburg impedance (Fig.14-3). This circuit (Fig.14-3), expresses the electrochemical system well.

Fig. 14-1 Nyquist plot of Warburg impedance.

Fig. 14-2 Randles circuit.

Fig.14-3 Randles circuit with ZW.
The Nyquist plot semicircle starting from the origin shown in the previous section was generated by a CR parallel circuit. When the solution resistance is connected in series to this, the figure shown at the first time is obtained by shifting the solution resistance from the origin.

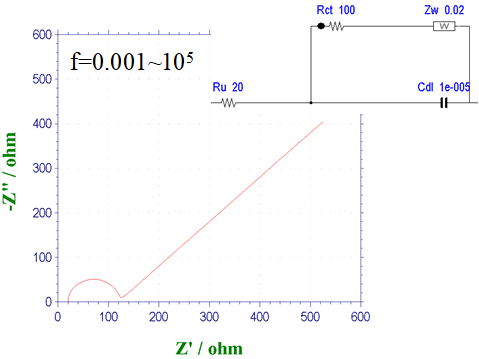
Fig. 14-4 Nyquist diagram for a Randles circuit with ZW.
Fig. 14-4 shows the Nyquist plot of the Randles circuit (Fig. 14-3) with the addition of the Warburg impedance ZW. The effect of diffusion becomes more pronounced at low frequencies, and the Nyquist plot shows a semicircle derived from the electron transfer process followed by a straight line with a 45° slope derived from the diffusion process. This is the case when the electron transfer rate is moderate. For example, in the ferrocyanide/ferricyanide system, the diameter of the semicircle changes markedly because the electron transfer rate is sensitive to the degree of contamination of the electrode. If the electron transfer rate becomes too slow, the semicircle becomes too large and the 45° line becomes less visible, resulting in only the semicircle being visible.
When the electron transfer rate is very fast, as in ferrocene, the semicircle is not visible, but only the 45° line is.

