TOP > Technical note > Basics for who are starting electrochemistry > Basics and applications of electrochemistry > Electrochemical Impedance Spectroscopy (EIS) > EIS V

Equation 18-1
The equation is very similar to the previous ND, but the function is different from tanh to coth. If the Waalburg impedance part of the equivalent circuit (extended Randles circuit) that adds Warburg impedance to the Randles circuit is replaced with FD, it becomes an FD equivalent circuit.
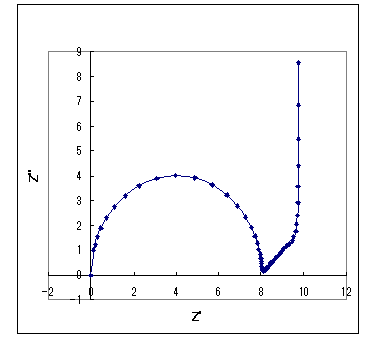
The simulation results for this equivalent circuit are shown in Fig. 18- 1. The charge transfer resistance (Rct), double layer capacitance (Cdl), finite film thickness δ, diffusion coefficient, and concentration (as shown), and solution resistance are zero. Of course, the solution resistance is present, but it only moves the position on the real axis, so it is omitted. The semicircle of the charge transfer process is followed by a straight line after a certain length of 45 degree gradient, rising perpendicular to the real axis in the low frequency band. When the finite film thickness δ decreases, the straight line of 45 degrees becomes shorter.

Fig. 18-1 Nyquist plot for the finite diffusion charge transfer case
Rct (Ω) = 8, Cdl (F/cm2) = 0.0001, δ (cm) = 0.1,
D = 0.0001 cm2/s, C (mol/cm3) = 0.0001
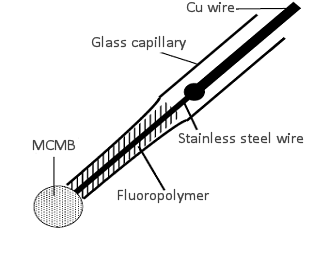
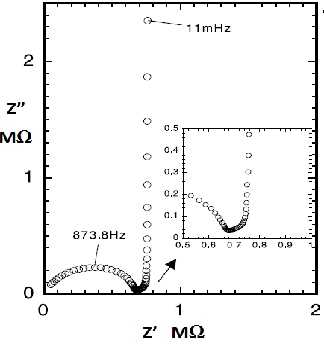
As a simple example, let's take the case of lithium intercalation into a single carbon sphere electrode 18-1). An electrode consisting of 30 µm diameter carbon sphere as shown in Fig. 18-2 was placed in 1 M LiClO4/propylene carbonate + ethylene carbonate (1:1) with a potential sweep of 1 mV/s between 0.01 - 0.6 V against Li/Li+ potential for three times, and then fixed at 0.3 V. The Nyquist plot obtained from the EIS measurement is shown in Fig. 18-3.

Fig. 18- 2 Schematic diagram of carbon sphere electrode (30 µm diameter.)

Fig. 18-3 Nyquist plot of lithium ion intercalation on micro carbon sphere electrode.
It can be seen that this is very similar to the simulated diagram in Fig. 18-1. This is typically seen in a Nyquist diagram, which is in a limited range of actives or limited migration, as in the case of lithium ion intercalation-deintercalation. Although somewhat difficult to understand, similar related literature detailing the theoretical background is listed here 18-2) - 18-3).
Reference:
18-1) Uchida et al., Electrochimica Acta 47, 885 (2001)
18-2) J. Newman et al., J. Electrochem. Soc. 147 2930 (2000)
18-3) M. D. Levi et al., J. Phys.Chem. B 108, 11693 (2004)
Part 7: Electrochemical Impedance Spectroscopy (EIS)
This is a basic introduction to the electrochemical measurement method electrochemical impedance spectroscopy (EIS).
The topics are listed below:
- EIS I: Basis for analysis of EIS results using equivalent circuits
- EIS II: Frequency variation and EIS measurements
- EIS III: Nyquist plot of circuit elements
- EIS IV: EIS IV: Warburg Impedance
- EIS V: Constant Phase Element Nyquist Plot
- EIS VI: Consider a system consisting of three elementary processes
- EIS VII: Nernst diffusion
- EIS VIII: Finite diffusion
- EIS IX: Dye-sensitized solar cell (DSSC) EIS - 1
- EIS X: Dye-sensitized solar cell (DSSC) EIS - 2
- EIS XI: Summary
EIS VIII: Finite diffusion
Laboratory Of Research & Development, BAS Inc.
Professor Noriyuki Watanabe
Professor Noriyuki Watanabe
In the previous article, we mentioned Nernst diffusion (ND). What about the other case of finite diffusion (FD)? The theoretical equation is shown below.

Equation 18-1
The simulation results for this equivalent circuit are shown in Fig. 18- 1. The charge transfer resistance (Rct), double layer capacitance (Cdl), finite film thickness δ, diffusion coefficient, and concentration (as shown), and solution resistance are zero. Of course, the solution resistance is present, but it only moves the position on the real axis, so it is omitted. The semicircle of the charge transfer process is followed by a straight line after a certain length of 45 degree gradient, rising perpendicular to the real axis in the low frequency band. When the finite film thickness δ decreases, the straight line of 45 degrees becomes shorter.

Fig. 18-1 Nyquist plot for the finite diffusion charge transfer case
Rct (Ω) = 8, Cdl (F/cm2) = 0.0001, δ (cm) = 0.1,
D = 0.0001 cm2/s, C (mol/cm3) = 0.0001
As a simple example, let's take the case of lithium intercalation into a single carbon sphere electrode 18-1). An electrode consisting of 30 µm diameter carbon sphere as shown in Fig. 18-2 was placed in 1 M LiClO4/propylene carbonate + ethylene carbonate (1:1) with a potential sweep of 1 mV/s between 0.01 - 0.6 V against Li/Li+ potential for three times, and then fixed at 0.3 V. The Nyquist plot obtained from the EIS measurement is shown in Fig. 18-3.

Fig. 18- 2 Schematic diagram of carbon sphere electrode (30 µm diameter.)

Fig. 18-3 Nyquist plot of lithium ion intercalation on micro carbon sphere electrode.
It can be seen that this is very similar to the simulated diagram in Fig. 18-1. This is typically seen in a Nyquist diagram, which is in a limited range of actives or limited migration, as in the case of lithium ion intercalation-deintercalation. Although somewhat difficult to understand, similar related literature detailing the theoretical background is listed here 18-2) - 18-3).
Reference:
18-1) Uchida et al., Electrochimica Acta 47, 885 (2001)
18-2) J. Newman et al., J. Electrochem. Soc. 147 2930 (2000)
18-3) M. D. Levi et al., J. Phys.Chem. B 108, 11693 (2004)

