TOP > Technical note > Basics for who are starting electrochemistry > Basics and applications of electrochemistry > Electrochemical Impedance Spectroscopy (EIS) > EIS VI
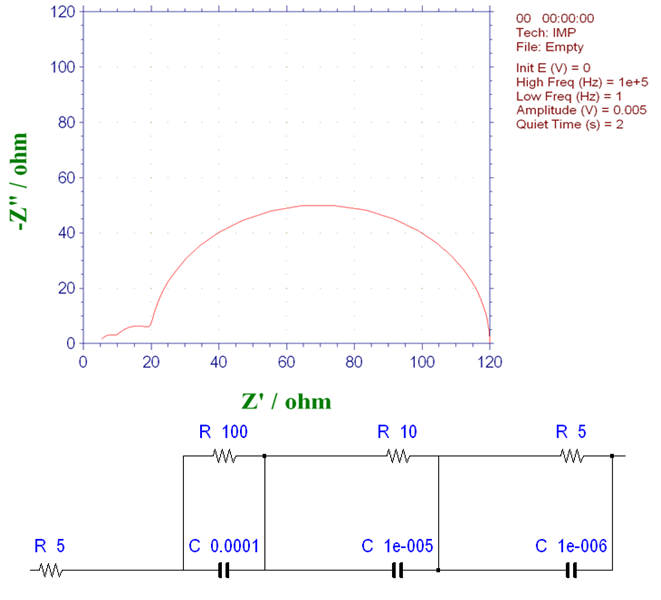
Consider a system consisting of three elementary processes with different time constants. The equivalent circuit and Nyquist plot are shown in Fig. 16-1. The three time constants are 10-2, 10-4, and 5×10⁻⁶ seconds respectively (as mentioned above, the time constant is given by the product of the parallel C×R circuit). Since the individual time constants are clearly different, it is possible to separate and identify the three arcs.
The diameter of the semicircle matches the resistance value R of each parallel circuit. The process where the resistance is 100Ω corresponds to the largest arc. The time constant is 10-2 seconds, which appears on the lowest frequency side and reflects the longest fundamental process (as mentioned before, the frequency is higher the closer you are to the origin in the Nyquist plot and lower the further you are from the origin).

Fig. 16-1 Nyquist plot with three basic process systems that occur continuously (1)
In Fig. 16-1, the basic process of 5 x 10⁻⁶ seconds appears on the highest frequency side, reflecting the shortest time constant and corresponding to the process with the smallest parallel resistance. The middle arc corresponds to the basic process with a time constant of 10-4 seconds. Using the equation fmax = 1 /2πCR the value of the capacitance C can be obtained from the peak frequency of the half-circle (fmax) and the value of the resistance R.
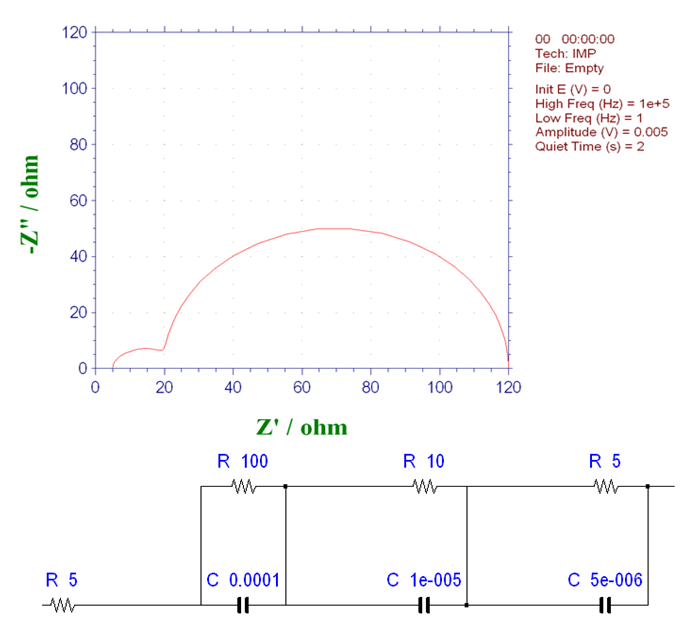
Even if it consists of three basic processes, if the time constants are relatively close (as shown in Fig. 16-2), the separation between them is not obvious. The ratio of the two time constants on the high-frequency side is 4, which is less than 20, which is the ratio of the two time constants in Fig. 16-1. Some separation trends can be seen, but the separation is not clear enough.
In the process of finding these equivalent circuits, it is important to consider whether the equivalent circuits correspond appropriately to actual chemical and physical phenomena. In this sense, resistance, capacitance and Warburg impedance are easy to consider.

Fig. 16-2 Nyquist plot with three basic process systems that occur continuously (2)
Resistance reflects, for example, the resistance of the medium itself, the rate of charge transfer at the interface and the magnitude of the ion transport rate in solutions, films and various other media. If the rate of electron transfer at the electrode is slow, this corresponds to a larger resistance. Capacitance is formed as a result of the formation of polar interfaces, the charging/discharging of charges, etc.
In addition, the term Warburg appears in various phenomena involving diffusion. Fortunately, the time constants for these phenomena are empirically cumulative or can be roughly estimated. On the other hand, for CPE, we can construct a model from simulations that is compatible with the Mathematically, however, the model can be capacitive, resistive or inductive, depending on the choice of n. It must therefore be recognized that it is difficult to describe its chemical or physical phenomena measurements from these alone.
Part 7: Electrochemical Impedance Spectroscopy (EIS)
This is a basic introduction to the electrochemical measurement method electrochemical impedance spectroscopy (EIS).
The topics are listed below:
- EIS I: Basis for analysis of EIS results using equivalent circuits
- EIS II: Frequency variation and EIS measurements
- EIS III: Nyquist plot of circuit elements
- EIS IV: EIS IV: Warburg Impedance
- EIS V: Constant Phase Element Nyquist Plot
- EIS VI: Consider a system consisting of three elementary processes
- EIS VII: Nernst diffusion
- EIS VIII: Finite diffusion
- EIS IX: Dye-sensitized solar cell (DSSC) EIS - 1
- EIS X: Dye-sensitized solar cell (DSSC) EIS - 2
- EIS XI: Summary
EIS VI: Consider a system consisting of three elementary processes
Laboratory Of Research & Development, BAS Inc.
Professor Noriyuki Watanabe
Professor Noriyuki Watanabe
The diameter of the semicircle matches the resistance value R of each parallel circuit. The process where the resistance is 100Ω corresponds to the largest arc. The time constant is 10-2 seconds, which appears on the lowest frequency side and reflects the longest fundamental process (as mentioned before, the frequency is higher the closer you are to the origin in the Nyquist plot and lower the further you are from the origin).

Fig. 16-1 Nyquist plot with three basic process systems that occur continuously (1)
In Fig. 16-1, the basic process of 5 x 10⁻⁶ seconds appears on the highest frequency side, reflecting the shortest time constant and corresponding to the process with the smallest parallel resistance. The middle arc corresponds to the basic process with a time constant of 10-4 seconds. Using the equation fmax = 1 /2πCR the value of the capacitance C can be obtained from the peak frequency of the half-circle (fmax) and the value of the resistance R.
In the process of finding these equivalent circuits, it is important to consider whether the equivalent circuits correspond appropriately to actual chemical and physical phenomena. In this sense, resistance, capacitance and Warburg impedance are easy to consider.

Fig. 16-2 Nyquist plot with three basic process systems that occur continuously (2)
Resistance reflects, for example, the resistance of the medium itself, the rate of charge transfer at the interface and the magnitude of the ion transport rate in solutions, films and various other media. If the rate of electron transfer at the electrode is slow, this corresponds to a larger resistance. Capacitance is formed as a result of the formation of polar interfaces, the charging/discharging of charges, etc.
In addition, the term Warburg appears in various phenomena involving diffusion. Fortunately, the time constants for these phenomena are empirically cumulative or can be roughly estimated. On the other hand, for CPE, we can construct a model from simulations that is compatible with the Mathematically, however, the model can be capacitive, resistive or inductive, depending on the choice of n. It must therefore be recognized that it is difficult to describe its chemical or physical phenomena measurements from these alone.

