Part 7: Electrochemical Impedance Spectroscopy (EIS)
This is a basic introduction to the electrochemical measurement method electrochemical impedance spectroscopy (EIS).
The topics are listed below:
- EIS I: Basis for analysis of EIS results using equivalent circuits
- EIS II: Frequency variation and EIS measurements
- EIS III: Nyquist plot of circuit elements
- EIS IV: EIS IV: Warburg Impedance
- EIS V: Constant Phase Element Nyquist Plot
- EIS VI: Consider a system consisting of three elementary processes
- EIS VII: Nernst diffusion
- EIS VIII: Finite diffusion
- EIS IX: Dye-sensitized solar cell (DSSC) EIS - 1
- EIS X: Dye-sensitized solar cell (DSSC) EIS - 2
- EIS XI: Summary
EIS IX: Dye-sensitized solar cell (DSSC) EIS-1
Professor Noriyuki Watanabe
The rt on the upper side line is the differential contribution of the resistance component originating from the velocity of electron movement in the titanium oxide particles, and the lower side line is the differential contribution of the resistance component on the solution side, which is very small and can be ignored.

Fig. 19-1 TiO2 anode transmission line model diagram.
The parallel circuit connecting the top and bottom consists of the differential contribution of the resistance component, rk, which corresponds to the recombination reaction rate of electrons at the nanoparticle / solution interface, and the differential contribution of the capacitance, cm, which is a combination The impedance of this model is given by equation 19-1. Of the interfacial double layer capacitance and the chemical capacitance (corresponding to the change in electron density injected into the TiO2 particles).
 Eq. (19-1)
When the thickness of the TiO2 film electrode is L,
- Rt = rtL
- Rct = rk/L
- Cm = cmL
- ωk = 1/CmRct
- ωd = 1/CmRt
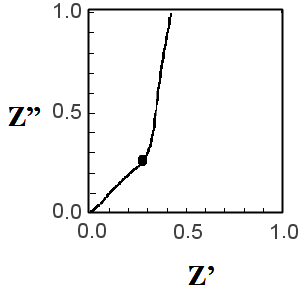
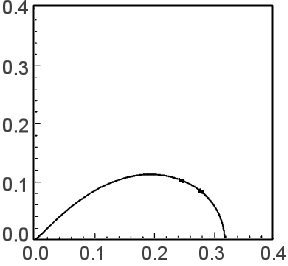
When Rt << Rct, Z = (Rt/3) + [Rct/{1 + (iω/ωk)}] holds, and the Nyquist plot is as shown in Fig. 19-2. On the other hand, when Rt >> Rct, Z = [RtRct / {1 + (iω / ωk)}] 1/2 holds, and the Nyquist plot is as shown in Fig. 19-3. For DSSC, Fig. 19-2 is more desirable because Rct is much larger (i.e., there is less recombination of injected electrons).

Figure 19-2 TML model, if Rt << Rct

Fig. 19-3 In the case of Rt >> Rct

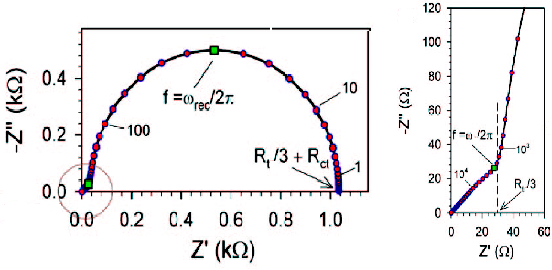
Fig. 19-4 Nyquist diagram for Rct >> Rt, titanium oxide anode
Fig. 19-2 shows an enlarged representation of the high frequency part. The entire image is shown in Fig. 19-4. The features are a straight line with a gradient of 45 degrees in the high frequency part and a single arc from the intermediate frequency to the low frequency part following it. The values of Rct, Rt, and Cm are obtained from the apex frequency of the arc (ωrec/2π), the impedance at f = 0 (DC resistance, Rt/3 + Rct), and the value of the real axis (Rt/3) at the intersection of the arc and the straight line in the high frequency section. Rct (or Rec) is the resistance of the recombination reaction of electrons in the TiO2 electrode (mainly consumed by the reduction of I3- in the electrolyte). The larger Cm is, the better.
RctCm is the time constant of the semicircle in the low frequency range, and a large value of RctCm means that the semicircle appears at as low a frequency as possible and the diameter of the semicircle is large. It may seem strange that the larger the resistance and the larger the semicircle, the better the DSSC works, because the slower the recombination reaction rate is, the less loss there is. This method has been developed by Bisquert's group19-1) and is applicable to the analysis of perovskite-type SC, which have recently attracted much attention.
Reference:
19-1) J. Bisquert et al., J.Am.Chem.Soc., 130, 11312 (2008)

