Basis of Potentiostat
- Part 1: Potentiostat circuit configuration and its features
- Part 2: Bi-Potentiostat
- Part 3: Positive Feedback
- Part 4: The solution resistance and the iR compensation
- Part 5: Electron transfer rate
- Part 6: Redox Potential - I
- Part 7: Redox Potential - II
- Part 8: Redox Potential - III
- Part 9: Redox Potential - IV
- Part 10: Redox Potential - V
- Part 11: Electrochemical Impedance Spectroscopy (EIS) - I
- Part 12: Electrochemical Impedance Spectroscopy (EIS) - II
- Part 13: Electrochemical Impedance Spectroscopy (EIS) - III
- Part 14: Electrochemical Impedance Spectroscopy (EIS) - IV
TOP > Technical note > Basics for who are starting electrochemistry > Basics and applications of electrochemistry
This content explains the basics and applications in electrochemistry.
The topics are listed below:
- Part 1: Potentiostat circuit configuration and its features
- Part 2: Bi-Potentiostat
- Part 3: Positive Feedback
- Part 4: The solution resistance and the iR compensation
- Part 5: Electron transfer rate
- Part 6: Redox Potential
- Part 7: Electrochemical Impedance Spectroscopy (EIS)
- Part 8: CV (Cyclic Voltammetry)
Part 1: Potentiostat circuit configuration and its features
Professor Noriyuki Watanabe
It is well know that a potentiostat is essential in electrochemical measurements.
The Op amps (operational amplifiers) are used for the potentiostat. An overview of Op amp is introduced here, instead of the detailed commentary. The symbol of Op amp is a triangle mark with + and - two input terminals and one output terminal.
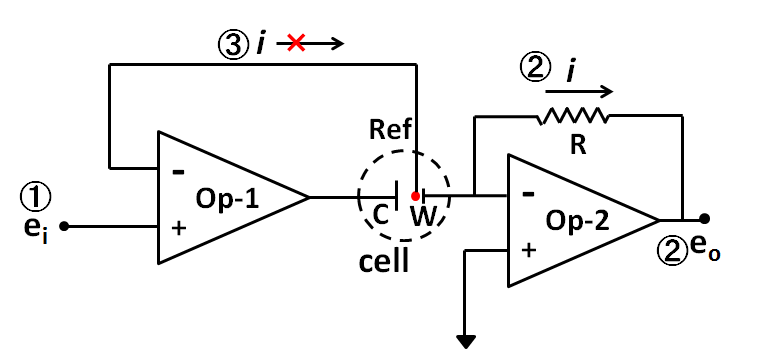
Fig. 1 The basic circuit diagram of potentiostat.
As a result, there are no currents flowing into and out of the two input terminals (because the input impedance is very large) and the two input terminals have the same voltage (the potential difference between the two input terminals is zero). If the both points were memorized, the circuit configurations would be just understood.
Due to these features of the Op amp, the potentiostat can be consisted by the combination of at least two operational amplifiers (In Figure 1. dashed circle is the mark for the cell, while W, C, Ref are represented for working electrode, counter electrode and reference electrode respectively).
The fundamental functions of the potentiostat are summarized into ① the working electrode potential regulation versus the reference electrode, ② measuring the current flowing through the working electrode, ③ no current flowing to the reference electrode, these three points.
First of all ① the voltage applied from the outside (setting potential, applied potential) ei is same to the voltage applied to the reference electrode (because the voltages at both input terminals of Op-1 is equal). On the other hand, the voltage of the working electrode is the ground voltage (+ input terminal is grounded, - input terminal is floating, whereas the two input terminals are the same potential, the potential is equivalent to ground. This is called a virtual ground.). That is, the working electrode is at the potential of -ei respecting to the reference electrode. Through this configuration, i) the working electrode potential regulation versus the reference electrode is established.
The function ② is a circuit that outputs a voltage proportional to the current i flowing through the working electrode in Op-2, ② measuring the current flowing through the working electrode is realized (function 2).
The reference electrode is connected independently to the minus input end of Op-1. Because the impedance at the input end is extremely large, no current flow. That is, ③ no current flowing to the reference electrode is realized.
Above are the three fundamental functions of the potentiostat.
From what you see, the reason why the counter electrode and the working electrode must be connected to completely different points in terms of circuit inside the potentiostat can be understood.
As mentioned in previous "Counter Electrode" technical note, in the case of two-electrodes system, it is difficult to differentiate between the counter electrode and the working electrode, whereas in three-electrodes system using potentiostat, they are clearly distinguished.
TOP > Technical note > Basics for who are starting electrochemistry > Basics and applications of electrochemistry
This content explains the basics and applications in electrochemistry.
The topics are listed below:
- Part 1: Potentiostat circuit configuration and its features
- Part 2: Bi-Potentiostat
- Part 3: Positive Feedback
- Part 4: The solution resistance and the iR compensation
- Part 5: Electron transfer rate
- Part 6: Redox Potential
- Part 7: Electrochemical Impedance Spectroscopy (EIS)
- Part 8: CV (Cyclic Voltammetry)
Part 2: Bi-Potentiostat
Professor Noriyuki Watanabe
Last time , the potentiostat could be theoretically consisted by the combination of at least two operational amplifiers, the establishment of three fundamental functions (①, the working electrode potential regulation versus the reference electrode, ② measuring the current flowing through the working electrode, ③ no current flowing to the reference electrode), and the points for understanding the function of Op amp (both of input terminals had the same voltage and the input impedance was too large that the current could not flow in or flow out of the Op amp within two input terminals.) were demonstrated.
A typical application example is rotating ring disk electrode (RRDE). In addition, it can be used as the dual working electrodes electrochemical detector (twin-electrode LCEC) as liquid chromatography detectors, and in some cases, it can also be used for liquid-liquid interface voltammetry.
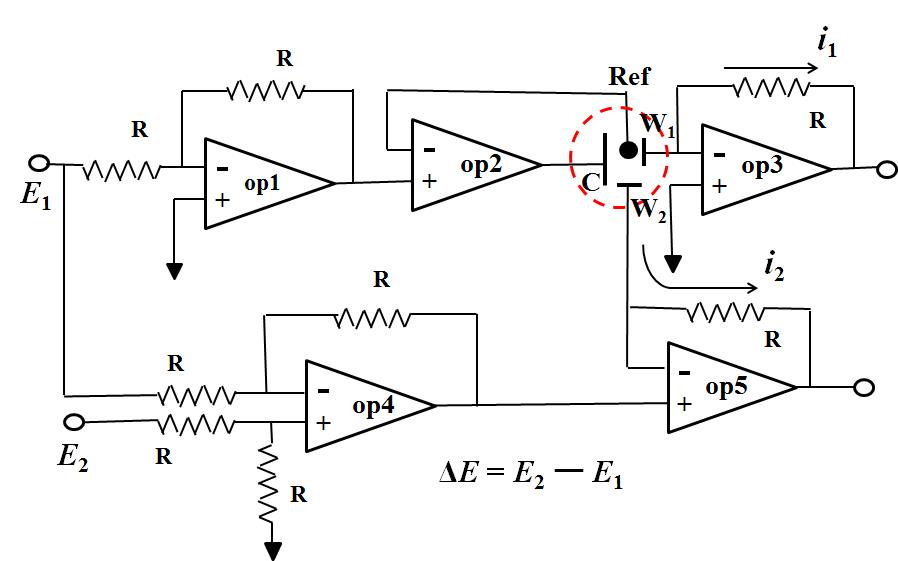
Fig.2 Five Op amps used circuit diagram of bi-potentiostat.
Fig.2 is five Op amps used circuit diagram of bi-potentiostat. The potential of the working electrode 1 (W1) is controlled by Op amp1 and Op amp2 which is same as previously described (only one Op amp used in the previous artical), the regulated potential is E1. Op amp4 is a subtraction circuit which outputs the difference signal between E1 and E2, while becomes the + input terminal of the OP amp5 (signal difference ΔE = E2 - E1). Because the voltages of the + input terminal and the - input terminal are the same (described previously), the potential applied to the working electrode 2 is E2 - E1. E1 is the potential applied to the electrode 1, E2 can completely be selected independently. Therefore, the electrode 2 can be independently controlled.
In this manner, for example of RRDE, it is possible to apply an arbitrary potential independently for the disk electrode and the ring electrode respectively versus the common reference electrode.
Two points in final. One point is a voltage follower. Op Amp 2 is it. Since there is no else connection route to the + terminal except the signal from the former stage (Op amp 1) it has almost no current flow. Since the ─ terminal is the only connection to the reference electrode, there is no current flow over there, whereas the current can flow as the amplifier output (it is connected to the counter electrode C and becomes electrolytic current). This causes the possibility to pass a large current without current flow, that is, impedance conversion is performed. It is used frequently in potentiostat.
Another one point is a subtraction circuit and an addition circuit. In the subtraction circuit, it may be difficult to clearly understand the feature that there is no mutual interference between input signals, for the addition circuit, variables to be added are connected to the same input terminal, so it is easy to convince its effect.
The effective use of addition circuit for the solution resistance compensation positive feedback will be discussed in next edition.
TOP > Technical note > Basics for who are starting electrochemistry > Basics and applications of electrochemistry
This content explains the basics and applications in electrochemistry.
The topics are listed below:
- Part 1: Potentiostat circuit configuration and its features
- Part 2: Bi-Potentiostat
- Part 3: Positive Feedback
- Part 4: The solution resistance and the iR compensation
- Part 5: Electron transfer rate
- Part 6: Redox Potential
- Part 7: Electrochemical Impedance Spectroscopy (EIS)
- Part 8: CV (Cyclic Voltammetry)
Part 3: Positive Feedback
Professor Noriyuki Watanabe
In the previous two editions, the potentiostat was talked and the continuation will be presented. The positive feedback is a topic here. This is an optional function which is not always necessary, but you may select to use it, if you need.
When the current flows through the electrolysis cell, a voltage drop proportional to the product of solution resistance and the current value occurs. The potentiostat can not recognize a potential drop proportional to the solution resistance between the working electrode and the reference electrode, while controls the potential of the working electrode.
Since the set up potential is just applied between the working electrode and the reference electrode including this partial of the potential drop, the actual potential applied to working electrode is insufficient by the amount of potential drop.
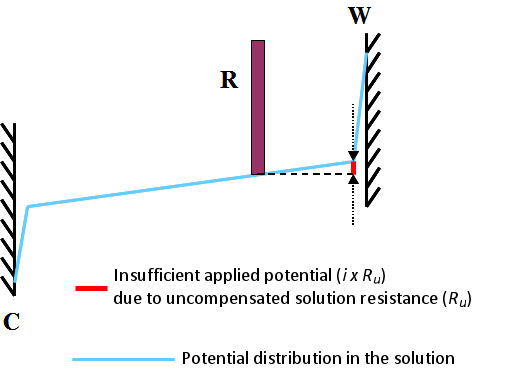
Fig. 3.1 Insufficient applied potential due to uncompensated solution resistance (Ru), W, C, R are the working electrode, the counter electrode and the reference electrode.
This is commonly called uncompensated solution resistance and is marked as Ru. It can be schematically depicted as shown in Fig. 3.1. It shows the state when the current i flows a cell. Subscript u comes from the meaning of either “unkown” or “uncontrollable”.
Even with a potentiostat, such potential drop can not be controlled completely. The only alternative is to deal with incomplete methods with positive feedback as described below.
The unfavorable effect caused by this uncompensated solution resistance is, for example, a peak potential shift and an extra spread of the peak potential width in a CV (Cyclic Voltammetry) measurement.
The deviation of the peak potential causes a difference between the absolute values of the oxidation peak current and the reduction peak current, and the redox potential estimated from the average of the two peak potentials will slightly deviate. Besides, the electron transfer speed calculated from the peak potential width will be slower. For this reason, it is necessary to reduce the effect of uncompensated solution resistance. The method is positive feedback.
The positive feedback circuit can be configured with three op amps as shown in Fig. 3.2. An additive circuit (op 1) is added to the prototype basic circuit (configured by two op amp) prototype which was mentioned before.
This makes a considerable improvement for the electrochemical measurement. Please do not forget that positive feedback function is not perfect.
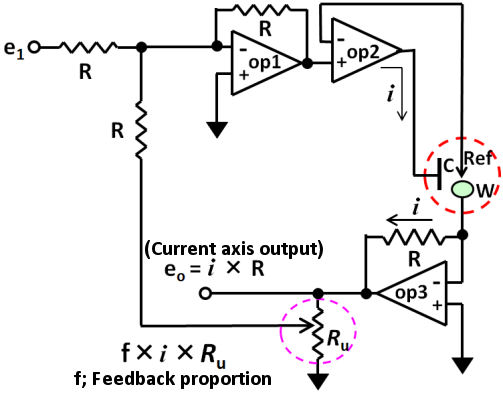
Fig. 3.2 The positive feedback circuit for iR compensation.
TOP > Technical note > Basics for who are starting electrochemistry > Basics and applications of electrochemistry
This content explains the basics and applications in electrochemistry.
The topics are listed below:
- Part 1: Potentiostat circuit configuration and its features
- Part 2: Bi-Potentiostat
- Part 3: Positive Feedback
- Part 4: The solution resistance and the iR compensation
- Part 5: Electron transfer rate
- Part 6: Redox Potential
- Part 7: Electrochemical Impedance Spectroscopy (EIS)
- Part 8: CV (Cyclic Voltammetry)
Part 4: The solution resistance and the iR compensation
Professor Noriyuki Watanabe
In last issue, the positive feedback and the potentiostat might measure the uncompensated solution resistance (Ru) was mentioned, whereas, considering there might be some people want to know how the potentiostat could measure the Ru, therefore, we would like to make it clear in this issue.
The impedance contents of a three electrodes configured cell can be expressed as shown in Fig. 4-1.

Fig. 4-1 Impedance of a three electrodes configured cell.
Zf is the Faraday impedance related to the redox reaction of active species (not considering the diffusion impedance of active species) in solution.
The solution resistance includes the resistance (Rs) between the counter electrode and the reference electrode, and the resistance (Ru) between the reference electrode and the working electrode, which across the reference electrode (usually represented by Rs, Ru respectively). The potentiostat can consider the Rs but can not recognize the Ru (therefore, the potential drop due to the product of the current flowing in the cell and the uncompensated solution resistance i x Ru can’t be controlled by the potentiostat.).
The Zf can be considered as near to infinity at the potential that the redox reaction does not occur, so a substitute equivalent circuit in which the double layer capacity Cdl is in series with the uncompensated solution resistance can be considered.
When a small step voltage ΔE (such as 50 mV) is applied to such a circuit, the response current can be described in a scheme which shown in Fig. 4-2.
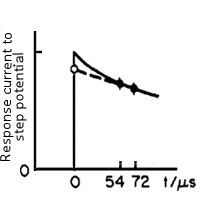
Fig. 4-2 The time domain of the response current, under a small step voltage applying.
The response current can be expressed by an exponential function with the time constant of RuCdl (the below equation).
When t = 0, the exponential function is 1, so i(0) = ΔE / Ru. That is, if the current value is obtained immediately after the potential applying, as the ΔE is a set value and is known (for example, when set to 50 mV), the value of Ru can be obtained.
The current value at time zero is measured in the manner as shown in Fig. 4-2, that is the current value at two points after the potential step (52 and 72 microseconds in Fig. 4-2) are measured and approximated by extrapolating it to zero time.
When the time constant of the cell (given by Ru × Cdl) is smaller than the rise time of the potentiostat, the error may be large, whatever, such a case means that Ru is small and is almost no need for the iR compensation.
Positive feedback is done using solution resistance Ru obtained in this way. Since Ru is much affected by the position of the reference electrode, it is desirable to place it as near as possible to the working electrode and be careful not to vary for each measurement. Under the minute current of the microelectrode, since the influence is small, the problem of solution resistance is small. In the bulk electrolysis with large current amount, there is a margin in potential setting, so there are relatively less problems. Please note that iR compensation causes instability of the potentiostat, if it is large amount of compensation.
TOP > Technical note > Basics for who are starting electrochemistry > Basics and applications of electrochemistry
This content explains the basics and applications in electrochemistry.
The topics are listed below:
- Part 1: Potentiostat circuit configuration and its features
- Part 2: Bi-Potentiostat
- Part 3: Positive Feedback
- Part 4: The solution resistance and the iR compensation
- Part 5: Electron transfer rate
- Part 6: Redox Potential
- Part 7: Electrochemical Impedance Spectroscopy (EIS)
- Part 8: CV (Cyclic Voltammetry)
Part 5: Electron transfer rate
Professor Noriyuki Watanabe
A method using CV to obtain electron transfer rate (ks),which announced about 50 years ago is usually used (Ref. 5-1).
At room temperature, for the single electron transfer reversible reaction,ΔEp is slightly less than 60 mV, this value will increase if the electron transfer rate changed to be slower.
This state can be shown in Fig. 5-1 by CV simulation.
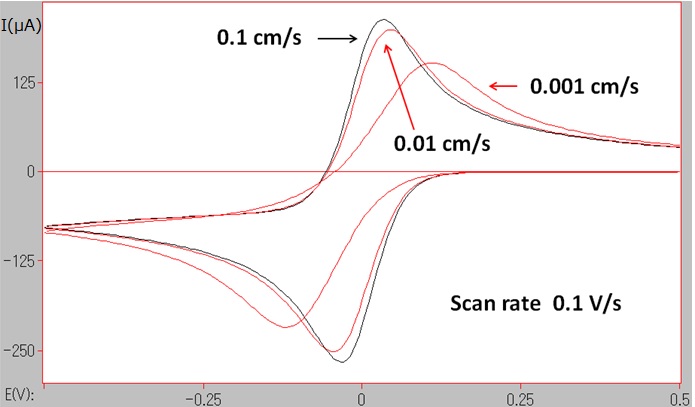
Fig.5-1 CV simulations at different electron transfer rates (ks = 0.1, 0.01, 0.001 cm/s).
The electron transfer rate is depended on the activation energy amount during the electron transfer process, and is also influenced by the molecule structure change and the change of the solvation before and after the electron transfer process.
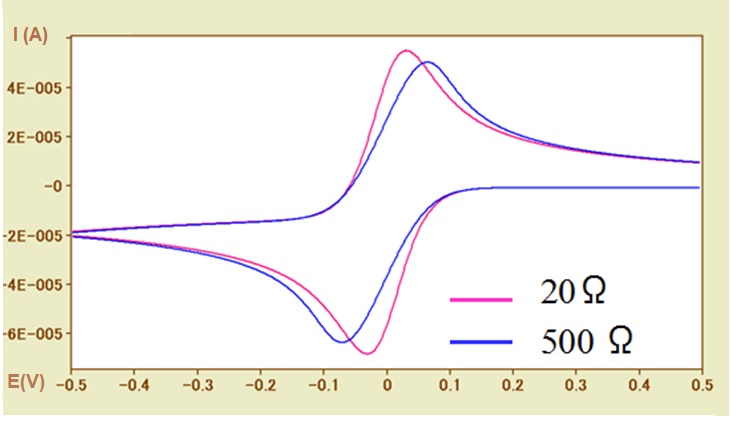
Fig.5-2 CV simulations for different solution resistances (Ru = 20Ω, 500Ω).
Examining such kinetic parameter as well as investigating the redox potential which is a thermodynamic parameter, are the important objectives in electrochemical measurements.
Incidentally, the peak potential width (ΔEp) does not only change due to the electron transfer rate, but also the uncompensated solution resistance may greatly influence it. So far this has been mentioned several times.
Such situation can be shown in Figure 5-2. by CV simulation.
In the case of a fast electron transfer rate reaction system (ks = 0.1 cm / s), the CV curves of the uncompensated solution resistances of 20Ω (pink line) and 500Ω (blue line) are compared. With the increase of the solution resistance, the widening of the peak potential width (ΔEp) has a dependence on the solution resistance, which similar to the influence of the electron transfer rate, can be observed. The necessary of examining whether the solution resistance has influence in determining the electron transfer rate should be noted here.
In addition, the redox potential is calculated using the average value of the peak potential. However, the potential difference between the oxidation peak and the reduction peak is caused by the solution resistance, and thus the possibility of inequality should be considered also (although it is a trivial matter). In other words, the absolute values of the oxidation and reduction peak current values of are usually not exactly the same.
In Fig. 5-2, the baseline current of the oxidation peak is negative value, so the absolute value of the oxidation peak current is less than that of the reduction peak current with the zero baseline current.
Since the influence of the solution resistance on the potential shift is effective at the current (I) × solution resistance (R) (IR drop) result, therefore the current value is also quite important. By reducing the concentration of the electroactive species, or decreasing the electrode surface area (in the extreme case, the microelectrode can be used), etc. to reduce the current value, then to judge whether there is any effect of the solution resistance.
Reference:
5-1)R. S. Nicholson, Anal. Chem.,37, 1351 (1965)
TOP > Technical note > Basics for who are starting electrochemistry > Basics and applications of electrochemistry > Redox Potential > Redox Potential I
Part 6: Redox Potential
This is a basic introduction to the redox potential in electrochemistry.
The topics are listed below:
Redox Potential I: About HOMO and LUMO
Professor Noriyuki Watanabe
One of the purposes of the electrochemical measurement is to understand the redox potential of the subject. Oxidation-reduction potential is a characteristic feature of molecules that can be used for the identification and characterization of the substances. That is how to determine the redox potential. If you know this, you can use it as a guide to designing a substance with a desired redox potential.
The outer layer electrons of the substance (considering molecular species here) occupy the electronic energy level (also called orbital) in the turn from the low level to high level. The highest occupied energy level is defined as the highest occupied level (HOMO; Highest Occupied Molecular Orbital), the unoccupied energy level above it is called the lowest unoccupied molecular orbital (LUMO:Lowest Unoccupied Molecular Orbital), these electronic energy levels are involved in the reaction of molecular species.
For this reason, HOMO and LUMO are also called frontier levels. Regarding electrochemical reactions, oxidation is to remove electrons from HOMO, and reduction is to add electrons to LUMO.
Because the electronic level is the inherent feature of the substance, the redox potential is also a unique value of the substance. Formally, it is called standard oxidation reduction potential or formula amount oxidation reduction potential, but here it is expressed as redox potential (redox is a combination of reduction and oxidation).
As the redox potential of a molecular species depends on the locations of the HOMO - LUMO, it is possible to obtain it by theoretically quantum mechanical calculation. However, it may also be significance to understand which factors affect redox potential in quality. For this reason, it will be described in several times later.
HOMO, LUMO may determine the redox potential and cause the redox potential fluctuation. The fluctuation factor for the electronic energy level is mainly the electron density in the redox center (the site where electron transfer takes place), the electric charge around it (positive, negative, its size), and the influence of the medium is added as other factor too. When an organometallic compound is used as a material, its characterization can be considered.
Firstly, let’s consider the increase or decrease of the electron density of the redox center (site). For example, when the electron density of the redox center increases due to the influence of a substituent (electron-donating group), the electron level rises (becomes unstable), and the redox potential easily shifts to the negative direction, which makes it easy to be oxidized. On the other hand, if the electron density is lowered by a substituent (electron-withdrawing group), the opposite situation will occur.
For an example, let’s compare the acetyl group and the methyl group as the substituents of the ferrocene. The former acetyl group is electron-withdrawing group and reduces the electron density around iron which is a redox site, and methyl group is an electron donating group. Their effectiveness is almost directly proportional to the number of the substituents. The redox potential of ferrocene is shifted to the positive in 0.25 V when one acetyl substituent and 0.47 V positive shift when diacetyl group substituent. On the other hand, there is negative shift of 500mV when deca-methyl substituted ferrocene (when all hydrogen atoms are replaced by methyl groups). A negative shift of 50 mV is caused by per methyl group.
TOP > Technical note > Basics for who are starting electrochemistry > Basics and applications of electrochemistry > Redox Potential > Redox Potential II
Part 6: Redox Potential
This is a basic introduction to the redox potential in electrochemistry.
The topics are listed below:
Redox Potential II: About Ferrocene
Professor Noriyuki Watanabe
Ferrocene is a stable compound (yellow-orange), and the ferrocenium cation (blue) which undergoes single electron oxidation is also stable. The electron transfer rate between them is extremely fast, and it is a chemically and electrochemically reversible redox system.
Ferrocene is an important compound, not only can be recommended as an internal s redox potential standard in organic solvent system, but also can be used to synthesize various derivatives (e.g. bisferrocene, fulvalene, dendrimer, etc.) and for multiple applications (e.g. catalysts, sensors, media, Molecular labels, etc.).
A compound of which the central iron element replaced by other transition metal element is called metallocene, and it is useful as a reaction intermediate or a catalyst. Ferrocene was found independently in several places around 1951 and shortly after controversy on its structure, Wilkinson et al. determined its sandwich structure7-1), that iron element was pinched by cyclopentadiene group from the upper and lower sides, this discovery pioneered prosperity of organometallic compounds today.
That was an era of polarography using a mercury electrode. The redox potential was measured by using perchlorate (0.31 V vs. SCE) supporting electrolyte in a water-alcohol mixed solvent with a mercury drop working electrode7-2). It was fraudulent that redox potential could be measured well in the potential domain where the anode dissolution of the mercury electrode itself happening.
The accurate redox potential measurement in pure organic solvent systems was carried out in 1959 7-3). This research work was done by three graduate students from University of Kansas, during a short break in Easter holidays. Led by Ted Khuane, and the other two were graduate students from different research labs of the department of organic chemistry.
They two persons were responsible for the synthesis and purification of ferrocene and several ferrocene derivatives, ruthenocene and osmocene. At that time, cyclic voltammetry was not popular as it is now, and Kuwana adopted Chronopotentiometry (CP) which recorded the change of the working electrode potential versus time by applying a constant current flow. Although CP is not often used today, no need for the electrode potential feedback control, and once the electrode potential could be recorded correctly, it is a sufficiently simple method. The redox potential can be obtained from the transition time of CP.
At the beginning, Kuwana used a mercury electrode, however because of the too large background current flow, a platinum electrode was used as an alternative working electrode. At that time, his supervisor was Ralph Adams, a well-known pioneer of solid electrodes research work, replacing the working electrode with a platinum electrode was a natural thing.
Interestingly, there was no name of supervisor in Kuwana's paper. The details including this anecdote can be found in Bill Geiger's reviews 7-4). Recently, I (Watanabe) emailed Kuwana and received the reply from him. A partial of the reply was cited as “We did most of the work over Easter holiday. The faculty graciously let us publish without their names on the papers. Generous and unusual, needless to say.”. It was also an interesting paper that revealed the importance of the redox potential of the ferrocene could be controlled by substituents.
Reference:
7-1) Wilkinson,G., J.Am.Chem.Soc. 74, 6146, & 6148, (1952)
7-2) Page,J.A., Wilkinson,G. J.Am.Chem.Soc., 74,6149,(1952)
7-3) Kuwana,T.,Bublitz,D.E., Hoh,G. J.Am.Chem.Soc., 82, 5811, (1960)
7-4) Geiger W.E., Organometallics 26, 5738 (2007)
TOP > Technical note > Basics for who are starting electrochemistry > Basics and applications of electrochemistry > Redox Potential > Redox Potential III
Part 6: Redox Potential
This is a basic introduction to the redox potential in electrochemistry.
The topics are listed below:
- Redox Potential I: About HOMO and LUMO
- Redox Potential II: About Ferrocene
- Redox Potential III: Factors that determine redox potential
- Redox Potential IV: Organic transition metal complex
- Redox Potential V: Linear relationship between HOMO energy and redox potential
Redox Potential III: Factors that determine redox potential
Professor Noriyuki Watanabe
Regarding many organic transition metal compounds, when they are coordinated by the carbonyl (CO) which is a π electron acceptor, the redox potential may have a shift to the positive direction in large extent. This is due to the electrons in π symmetric orbitals of the central metal are reversely supplied (back donation) to the anti-particulate π orbits of the ligand, resulting the electron density of the central metal decreasing. Metal carbonyl compounds generally have high potentials and their potentials increase proportionally to the number of the carbonyl groups (Fig. 8-1).
Consequently, it is possible to estimate the extent of reverse donation according to infrared spectrums, and the redox potential measurements are often used in combination with IR measurements. An example for the metal cluster8-1) in Fig.8-2 is shown below.
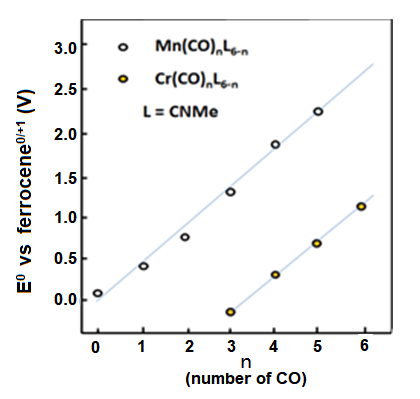 Fig. 8-1 The redox potential change of the manganese and chromium compounds when carbonyl groups substitute methyl isocyanate
The reversible redox potential of cyclopentadienyl manganese tricarbonyl (1) is 0.92 V vs. ferrocene reference.
The IR spectrum in the carbonyl region during the bulk electrolytic oxidation is shown in Fig.8-3.
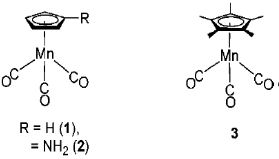
Fig.8-2 Manganese clusters
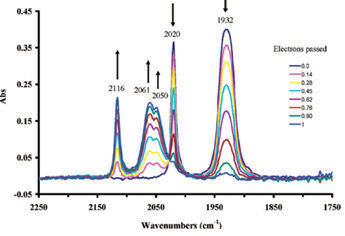
Fig. 8-3 Infrared spectrum changes of compound 1 during bulk electrolytic Oxidation
With electrolytic oxidation proceeding, the absorption intensity of two peaks belonging to 1 at the low wavenumber side (1930 cm-1, 2020 cm-1) are decreased, meanwhile three peaks (2050 cm-1, 2061 cm-1, 2116 cm-1) belonging to 1+ appear at the high wave number side, and their absorption intensity increase gradually.
Electrolytic oxidation causes the electron intensity decreasing around the manganese, thus the electron back donation is decreased. Therefore, the Mn-CO bond is weakened; on country indicate the enhancement of the CO bond.
The redox potentials of compounds 2 and 3 (Fig. 8-2) with amino or methyl substitutions on cyclopentenyl rings are in the negative direction comparing with compound 1.
This is due to the electron supplied property of the substituents, which increases the electron back donation from the central metal to the ligand CO, and the wavenumber of CO shifts to be low, in the IR spectrum of the CO stretching frequency (see below table).
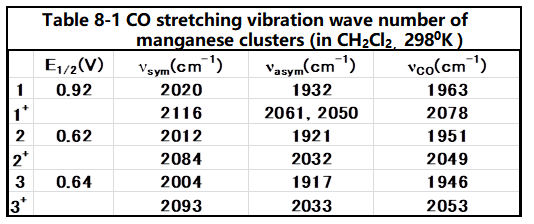
Reference:
8-1) W.E. Geiger et al., J. Am. Chem. Soc., 130, 9859 (2008)
TOP > Technical note > Basics for who are starting electrochemistry > Basics and applications of electrochemistry > Redox Potential > Redox Potential IV
Part 6: Redox Potential
This is a basic introduction to the redox potential in electrochemistry.
The topics are listed below:
- Redox Potential I: About HOMO and LUMO
- Redox Potential II: About Ferrocene
- Redox Potential III: Factors that determine redox potential
- Redox Potential IV: Organic transition metal complex
- Redox Potential V: Linear relationship between HOMO energy and redox potential
Redox Potential IV: Organic transition metal complex
Professor Noriyuki Watanabe
It is interesting to use organic transition metal complexes as materials to investigate the correspondence between redox potential and HOMO-LUMO.
Usually, the maximum number of valence electrons around a metal atom is 18 electrons (18-electron rule). Here, a six-coordinate, octahedral complex is considered. Due to the crystal field formed by the ligand, the 5 degenerate d orbitals of the central metal are split into the low-energy orbitals t2g (triple degenerate orbitals:dxy, dxz, dyz) and the high-energy eg orbitals (double degeneration orbitals:dz2 - Y2, dz2) (The energy difference between the two sets of degenerate orbits is the crystal field splitting energy Δ.). If the destabilizing electron pairing energy P is larger than the crystal field splitting energy Δ, in order to avoid electron pairing, d electrons will be sequentially filled into three t2g orbits and then into 2 eg orbits. Most of the electrons in d orbitals are in the state of parallel spins (high spin type). Conversely, if the crystal field splitting energy Δ is larger than the pairing energy P, even at the expense of the disadvantage of electron pairing energy, 6 electrons can enter into the more stable t2g orbits in paired distribution (low spin type).
When the redox center is a metal (HOMO and LUMO energy levels are from metal) atoms or ions, the redox potential will vary greatly depending on whether the HOMO or LUMO energy level is eg orbit or t2g orbit. If it is t2g orbit, the redox potential tends to be positive. Since the Crystal Field Theory originates from the electrostatic interaction formed by the charge of the ligand, it can only be considered as the interaction of σ-type molecular bonds.
Ligand Field Theory and Molecular Orbital Theory incorporating π-bond interaction are more realistic. Metals whose 3d, 4s, and 4p orbitals (in the case of the first transition metal) and the ligand orbitals (σ and π orbitals) have the same symmetry interact with each other. Generally, the d-orbital energy level of a metal is higher than the σ-orbital energy level of a ligand and lower than the empty π-orbital (semi-bonded orbital) energy level of a ligand.
When the π-type t2g orbital of a metal atom interacts with the π-type molecular empty orbital of a ligand molecule, the metal t2g orbital energy level is reduced. The difference between this orbital energy level and the orbital energy level of σ∗ (σ∗; anti-bonded molecular orbital, derived from eg orbitals of metal atoms) is called splitting energy Δ. It is known that the 18-electron rule is generally established from the valence orbital d5sp3 orbital of the metal participating in the bond (a total of 18 electrons because each 9 orbitals contains 2 electrons). When the π empty orbital energy level of the ligand (π∗; π anti-bond orbital of the ligand) is relatively low and close to the d orbital of the metal ion, the dπ (t2g) - π∗ (empty π) orbital interaction becomes larger. , the t2g orbital energy level is reduced, and the previously formed Crystal Field Splitting Energy Δ (split due to the interaction between such as 4s, 4p orbitals of the metal and the ligand σ-type orbitals) increases to Δ′ (Ligand Field Split Energy).
NH3 < NCR < PBu3 < PMe3 < P(OMe)3 < PPh3 < P(OPh)3 < PCl3 < PF3 < CNR < CO
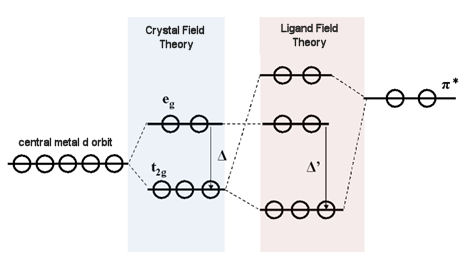
Fig.9-1. dπ (t2g) - π∗ interaction effect schematic diagram.
If the t2g orbital is at the HOM-LUMO level, the redox potential moves to positive due to its tending to a stable orientation (downward). For this reason, the redox potential of metal compounds coordinated with carbonyl or isocyanate is positive potential. On the other hand, the redox potential of amino compounds tends to show as a negative potential because the amino groups have low π acceptability and do not decrease the t2g orbitals energy level.~
As mentioned in previous issue, the reverse electron donor effect on the carbonyl group reduces the electron density around the metal, and the redox potential moves to positive, making it difficult to be oxidized, which can be explained by Ligand Field theory.
TOP > Technical note > Basics for who are starting electrochemistry > Basics and applications of electrochemistry > Redox Potential > Redox Potential V
Part 6: Redox Potential
This is a basic introduction to the redox potential in electrochemistry.
The topics are listed below:
- Redox Potential I: About HOMO and LUMO
- Redox Potential II: About Ferrocene
- Redox Potential III: Factors that determine redox potential
- Redox Potential IV: Organic transition metal complex
- Redox Potential V: Linear relationship between HOMO energy and redox potential
Redox Potential V: Linear relationship between HOMO energy and redox potential
Professor Noriyuki Watanabe
Mn[(CO)6-n(CNR)n]+, mentioned in the Redox Potential - III, is a representative example of the linear relationship between the HOMO energy and the redox potential of an organometallic compound by molecular orbital calculations10-1). The carbonyl is an σ-donor and a strong π-acceptor. Alkyl isocyanate is also an σ-donor and π-acceptor, but its π-acceptance is not as strong as that of carbonyl. As mentioned previously, when CO is bonded, t2g electrons from the metal d-orbital (also π-active) interact strongly with the π∗ orbital of CO (the semi-bondable orbital of CO), resulting in a reverse donor from the metal to the carbonyl. In the previous article, we stated that the redox potential is tilted in the positive direction because the t2g orbital is pushed down by the interaction with the π∗ orbital. The density of electrons around the metal is reduced due to the donation of electrons to the ligand. As a result, the redox potential is shifted in a positive direction because the metal center is less likely to be oxidized. Alternatively, the electron density around the metal is reduced and the effective nuclear charge is increased. The reduction of the HOMO level leads to a positive shift in the redox potential. In any case, the redox potential shifts positively when the number of COs to be bounded increases. Conversely, the reduction of the number of COs (and increase of n) shifts the redox potential in a negative direction.
Pletcher et al.10-1) gave the following equation for this relationship.
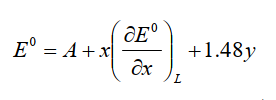
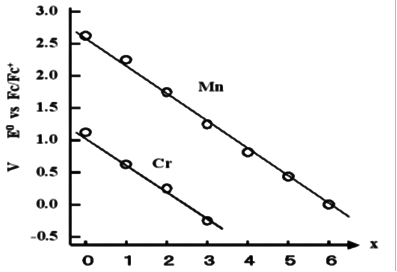
Fig.10-1. Number of acceptors and redox potential.
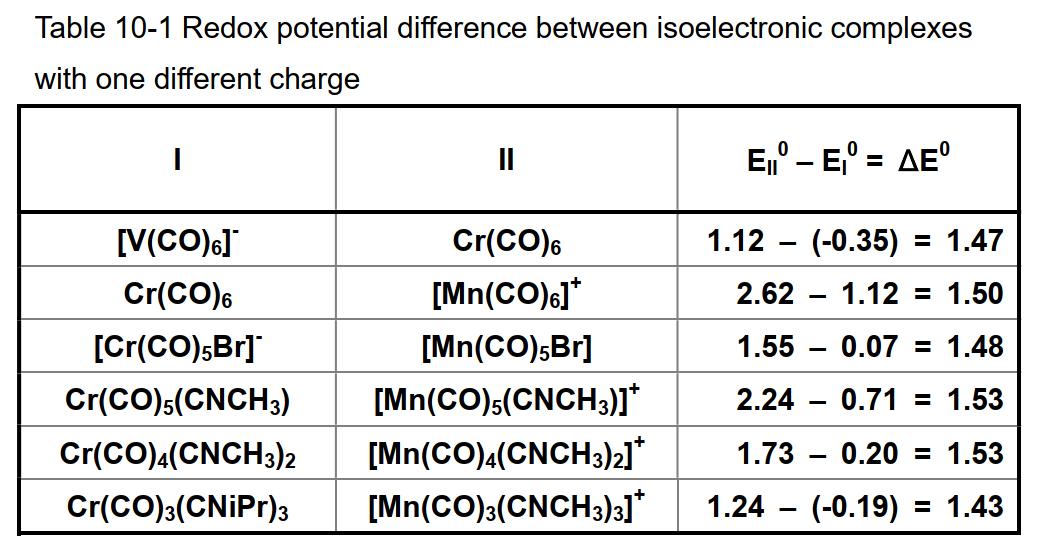
A is a constant determined by the medium (solvent and supporting electrolyte) used and the reference electrode, x is the number of ligands to substitute the carbonyl, and y is the charge of the complex. The coefficient of 1.48 for y is calculated from the average of the measured values of the carbonyl complex with the same number of carbonyls and the isoelectronic structure (table below). If the charge is increased by one, it means a shift of 1.48 V in the positive direction. This value is generally informative.
In redox systems that are similar on the periodic table with adjacent atoms, generally a metals with small atomic numbers tends to show redox reactions to more negative potential. This is true for the V, Cr and Mn series of hexacarbonyl isoelectric complexes. [ V-(CO)6; -0.35V, Cr(CO)6 ; +1.12V, Mn+(CO)6 ; +2.62V ]
Reference:
10-1) Pickett, Pletcher, J. Organometal. Chem., 102, 327 (1975)
TOP > Technical note > Basics for who are starting electrochemistry > Basics and applications of electrochemistry > Electrochemical Impedance Spectroscopy (EIS) > EIS I
Part 7: Electrochemical Impedance Spectroscopy (EIS)
This is a basic introduction to the electrochemical measurement method electrochemical impedance spectroscopy (EIS).
The topics are listed below:
- EIS I: Basis for analysis of EIS results using equivalent circuits
- EIS II: Frequency variation and EIS measurements
- EIS III: Nyquist plot of circuit elements
- EIS IV: Warburg Impedance
- EIS V: Constant Phase Element Nyquist Plot
- EIS VI: Consider a system consisting of three elementary processes
- EIS VII: Nernst diffusion
- EIS VIII: Finite diffusion
- EIS IX: Dye-sensitized solar cell (DSSC) EIS - 1
- EIS X: Dye-sensitized solar cell (DSSC) EIS - 2
- EIS XI: Summary
EIS I: Basis for analysis of EIS results using equivalent circuits
Professor Noriyuki Watanabe
In the Part 10: Redox Potential - V the discussion of redox potential finished, from this chapter the EIS (Electrochemical Impedance Spectroscopy) will be discussed. The most common method of EIS is the semicircular Nyquist plot shown in the figure below (the terminology of Nyquist plot will be explained later).
Why does it appear so often? Much of the usual electrochemistry deals with heterogeneous systems, that is, charge transfer phenomena at the electrode-solution interface. At the heterogeneous interface, a double layer with pairs of positive and negative charges is formed. That is, electrical capacity, which requires activation for charge transfer, which corresponds to an electrical resistance. These two generally occur simultaneously in parallel, and not in a sequential process, one after the other. There are so many states and phenomena that are replaced by parallel circuits (simultaneous processes) of resistance and capacitance.
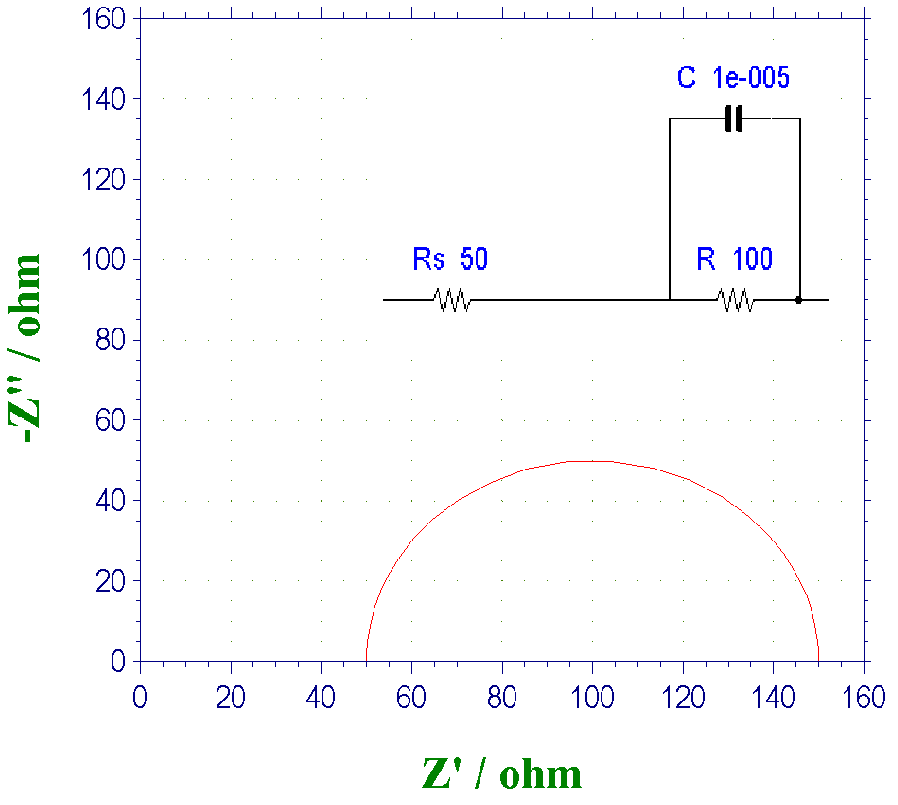
Fig.11-1. Example of Nyquist plot.
Following, the usefulness of Nyquist plot will be explained. The real and imaginary components of the impedance response when a small amplitude variable frequency AC potential is applied to the working electrode are plotted on the horizontal and vertical axes with frequency as a parameter. At high frequencies, the interface impedance can be regarded as zero because the impedance due to the capacitance C approaches zero (the charge transfer resistance does not work because it is equivalent to being shorted circuit). Then, only solution resistance remains. In other words, from the intersections of the semicircle and the real axis, the one closest to the origin corresponds to the resistance value of the solution Rs. On the other hand, at low frequencies, the impedance derived from the capacitance becomes very large, and as a result, only the charge transfer resistance component becomes visible. The sum of the resistance of the solution Rs and the charge transfer resistance R corresponds to the intersection (at frequency zero) of the semicircle and the real axis far from the origin. From the frequency fmax of the apex of the semicircle (in Nyquist plot, the frequency is a hidden parameter, it is obtained from other Bode plots), and the capacitance value can be calculated using the relation fmax = 1 / (2πRC). In this way, you can know the three values you want to find.
The reciprocal of fmax is time, which provides information such as the relaxation time, duration, and lifetime of the process. In general, on the Nyquist plot, high frequencies correspond to those closer to the origin and those far away correspond to frequency zero. The above is the typical usage of Nyquist plot.
TOP > Technical note > Basics for who are starting electrochemistry > Basics and applications of electrochemistry > Electrochemical Impedance Spectroscopy (EIS) > EIS II
Part 7: Electrochemical Impedance Spectroscopy (EIS)
This is a basic introduction to the electrochemical measurement method electrochemical impedance spectroscopy (EIS).
The topics are listed below:
- EIS I: Basis for analysis of EIS results using equivalent circuits
- EIS II: Frequency variation and EIS measurements
- EIS III: Nyquist plot of circuit elements
- EIS IV: Warburg Impedance
- EIS V: Constant Phase Element Nyquist Plot
- EIS VI: Consider a system consisting of three elementary processes
- EIS VII: Nernst diffusion
- EIS VIII: Finite diffusion
- EIS IX: Dye-sensitized solar cell (DSSC) EIS - 1
- EIS X: Dye-sensitized solar cell (DSSC) EIS - 2
- EIS XI: Summary
EIS II: Frequency variation and EIS measurements
Professor Noriyuki Watanabe
The EIS method generally requires the target measurement system to be in a stable state, that is, in a state that does not change with time. Apply a small AC voltage signal to the target measurement system (minimal conditions come from the requirement for linear response). Corresponding to the applied AC voltage small signal, a small AC current will be generated. The frequency of the response current and the frequency of the applied voltage may be the same, but there may be a phase difference. For a system consisting only of pure resistance, the phase difference is zero. If it is composed of pure capacitors, there is a 90-degree phase difference when the alternating current passes first.
The basic point of impedance measurement is to measure the amplitude and phase difference of the response AC current (so the data representation is basically two-dimensional). At this time, the frequency of the AC voltage will gradually change. The usual practice is to shake about 5 points in a frequency range 10 times the preset number of times. Therefore, low frequency measurement takes more time than high frequency measurement. Because the time required for a point depends on the frequency, the measurement target must be in a stable state. The impedance measurement is basically expressed by mathematical equations as follows.

The impedance is denoted by Z, j is an imaginary unit and ω is the frequency. The dots above the voltage V and current I indicate that they are a function of time. The impedance is the amplitude ratio of the voltage and the current. Although the two parameters, amplitude ratio and phase difference, are measured, they are usually broken down into the real and imaginary components of impedance, Z". If variable frequencies are included, the amplitude and phase difference take on three parameters. The frequency range usually covers 9 digits from 1 mHz to 1 MHz and the measurement time varies according to frequency. As extra time is required at low frequencies, the frequency can be reduced appropriately depending on the size of the characteristic time and the time constant included in the target.
There are two typical ways of representing impedance data. These are the Nyquist plot, illustrated in the previous article, and another Bode plot. In the Nyquist plot, the real and imaginary parts of the impedance are plotted on the real and imaginary axes respectively. In this case, frequency is plotted as a variable, but because it is a hidden variable, it is difficult to see it clearly, which is a disadvantage of the Nyquist plot. However, if the system contains multiple elementary processes and their time constants are widely separated from each other, the number of elementary processes can be seen as a number of characteristic semicircles combined to form a graph. Intuitive and easy to understand, it is convenient to obtain an overall view.
On the other hand, in a Byrd diagram, the horizontal axis is the logarithm of the frequency and the vertical axis is the logarithm of the absolute values of the impedance and phase difference. The characteristic of this graphical representation is that it is easy to see the range of frequencies over which the absolute value of the impedance and the phase difference change. As both representations have their own characteristics and advantages, it is easy to understand displaying the Nyquist and Bode plots together. When analysing EIS, it is common practice to replace the various electrochemical basic processes with components used in electronic circuits (resistors, capacitors, coils (induction), etc.). In the case of electrochemical elementary processes, electronic circuit elements alone are not sufficient and Warburg impedances corresponding to diffusion phenomena (both free and limited diffusion) and CPE (Constant Phase Element) with extended capacity are also added. These elements will be described in detail in the next section.
TOP > Technical note > Basics for who are starting electrochemistry > Basics and applications of electrochemistry > Electrochemical Impedance Spectroscopy (EIS) > EIS III
Part 7: Electrochemical Impedance Spectroscopy (EIS)
This is a basic introduction to the electrochemical measurement method electrochemical impedance spectroscopy (EIS).
The topics are listed below:
- EIS I: Basis for analysis of EIS results using equivalent circuits
- EIS II: Frequency variation and EIS measurements
- EIS III: Nyquist plot of circuit elements
- EIS IV: Warburg Impedance
- EIS V: Constant Phase Element Nyquist Plot
- EIS VI: Consider a system consisting of three elementary processes
- EIS VII: Nernst diffusion
- EIS VIII: Finite diffusion
- EIS IX: Dye-sensitized solar cell (DSSC) EIS - 1
- EIS X: Dye-sensitized solar cell (DSSC) EIS - 2
- EIS XI: Summary
EIS III: Nyquist plot of circuit elements
Professor Noriyuki Watanabe
Let us look at the Nyquist diagram of the circuit components. Consider first the object consisting only of a capacitor (Fig.13-1). This is a capacitor used as a circuit element. For DC, it cannot pass the capacitor, so no current flows. This corresponds to the situation where the electrode surface is in a potential region where no redox occurs. In other words, it is an electrode in a polarized potential region. It means that the wire is cut in the middle, which means that DC current cannot pass through, which is really easy to understand. It is a symbolic representation of an entity.
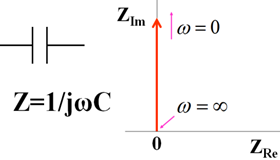
Fig.13-1. Capacitance symbol, expression, Nyquist diagram.
When expressed by the mathematical formula, Z = 1 ⁄ (ωC), which coincides with the imaginary axis in the Nyquist diagram. As the frequency approaches ∞ (infinity), the impedance approaches zero (the origin in the Nyquist diagram). If the AC frequency is high, the AC current will pass easily through the capacitor. Conversely, if the frequency is zero, that is, DC current will not flow through. In other words, the impedance becomes infinite, so it becomes a straight line that diverges to infinity and rises vertically from the origin. This is the Nyquist curve of capacity (red arrow → in the figure, which coincides with the imaginary axis).
Now, what happens if you connect a capacitor to a resistor? There are two ways to connect them: in parallel or in series with the capacity. Resistance means the force that prevents electrons or ions from moving when they move. It is the element that comes along with the transfer of charge. In this case, there is no phase difference between voltage and current.
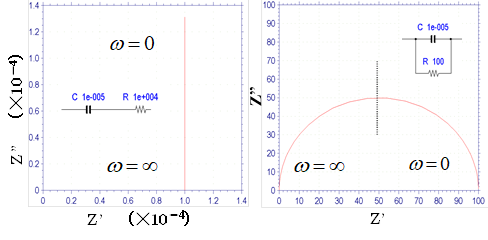
Fig.13-2. Nyquist diagram of the circuit when a capacitor and resistor are connected in series (left) and in parallel (right).
The left diagram in Fig.13-2. shows a capacitor connected in series with a resistor. The figure shows a Nyquist diagram of the capacitor that shifts the value of the resistor in the direction of the real axis. The right diagram shows a parallel circuit, and the Nyquist diagram is a semicircle. It intersects the origin at infinite frequency. In the case of high-frequency alternating current, a large amount of current is transmitted through the capacitor, and at the limit, impedance ofthe capacitor becomes zero. In the case of low-frequency alternating current, the impedance of the capacitor becomes large and the current is transmitted mainly through resistance, and at the limit of zero frequency the semicircle intersects the real axis at a position of equal magnitude of resistance.
This circuit connected in parallel can be viewed as a basic process and the resistance x capacitance = the time constant. The reciprocal of the frequency corresponding to the vertex of the semicircle is equal to the time constant. Since knowing the vertex frequency gives information about the time of the basic process, it is important to emphasize that this is used frequently. The left diagram in Fig.13-2 corresponds to a polarization electrode that has shifted its resistance value from the origin in parallel, and the right diagram corresponds to an electron transfer electrode when the solution resistance is zero, but in reality the solution resistance cannot be zero. A semicircle that has shifted the solution resistance value in parallel from the origin can usually be seen (Part 11, Fig.11-1. Nyquist legend). For the left figure, it is generally more common to see an inclined line or curve rather than a straight line that rises vertically.
TOP > Technical note > Basics for who are starting electrochemistry > Basics and applications of electrochemistry > Electrochemical Impedance Spectroscopy (EIS) > EIS IV
Part 7: Electrochemical Impedance Spectroscopy (EIS)
This is a basic introduction to the electrochemical measurement method electrochemical impedance spectroscopy (EIS).
The topics are listed below:
- EIS I: Basis for analysis of EIS results using equivalent circuits
- EIS II: Frequency variation and EIS measurements
- EIS III: Nyquist plot of circuit elements
- EIS IV: Warburg Impedance
- EIS V: Constant Phase Element Nyquist Plot
- EIS VI: Consider a system consisting of three elementary processes
- EIS VII: Nernst diffusion
- EIS VIII: Finite diffusion
- EIS IX: Dye-sensitized solar cell (DSSC) EIS - 1
- EIS X: Dye-sensitized solar cell (DSSC) EIS - 2
- EIS XI: Summary
EIS IV: EIS IV: Warburg Impedance
Professor Noriyuki Watanabe
Diffusion plays an important role in electrochemical reactions. The Warburg impedance (ZW) element has been introduced for a long time to the processes in which the diffusion is involved, and it is expressed by the complex equation (1).


The so-called Randle's circuit (Fig. 14-2), in which the solution resistance (Rs) is connected in series with the parallel circuit of the electron transfer resistance at the electrode/electrolyte solution interface (the inverse of the electron transfer rate, Rct) ) and the interfacial double layer capacitance (Cdl) (these two are simultaneous processes), is further represented by an equivalent circuit containing the Warburg impedance (Fig.14-3). This circuit (Fig.14-3), expresses the electrochemical system well.
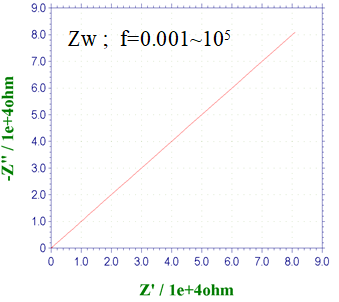
Fig. 14-1 Nyquist plot of Warburg impedance.
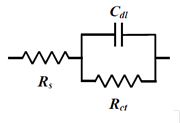
Fig. 14-2 Randles circuit.
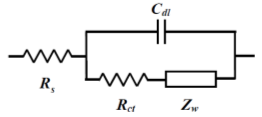
Fig.14-3 Randles circuit with ZW.
The Nyquist plot semicircle starting from the origin shown in the previous section was generated by a CR parallel circuit. When the solution resistance is connected in series to this, the figure shown at the first time is obtained by shifting the solution resistance from the origin.
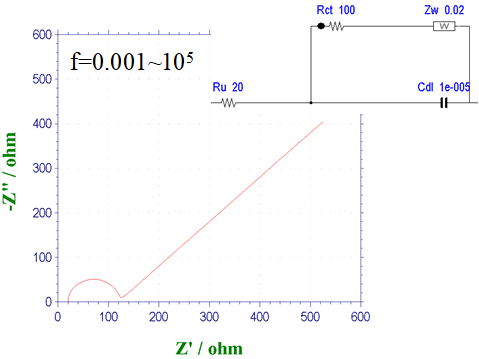
Fig. 14-4 Nyquist diagram for a Randles circuit with ZW.
Fig. 14-4 shows the Nyquist plot of the Randles circuit (Fig. 14-3) with the addition of the Warburg impedance ZW. The effect of diffusion becomes more pronounced at low frequencies, and the Nyquist plot shows a semicircle derived from the electron transfer process followed by a straight line with a 45° slope derived from the diffusion process. This is the case when the electron transfer rate is moderate. For example, in the ferrocyanide/ferricyanide system, the diameter of the semicircle changes markedly because the electron transfer rate is sensitive to the degree of contamination of the electrode. If the electron transfer rate becomes too slow, the semicircle becomes too large and the 45° line becomes less visible, resulting in only the semicircle being visible.
When the electron transfer rate is very fast, as in ferrocene, the semicircle is not visible, but only the 45° line is.

